- About
- Browse Articles
-
Special Issues
- Pioneering strategies for overcoming bacterial drug resistance (2026)
- Advancing microbial engineering through synthetic biology (2025)
- Host-associated microbiome (2024)
- Bacterial regulatory mechanisms for the control of complex cellular mechanisms (2023)
- Two years into COVID-19 pandemic: Where are we? (2022)
- Collections
- For Contributors
- Policies
- E-Submission

- About
- Browse Articles
-
Special Issues
- Pioneering strategies for overcoming bacterial drug resistance (2026)
- Advancing microbial engineering through synthetic biology (2025)
- Host-associated microbiome (2024)
- Bacterial regulatory mechanisms for the control of complex cellular mechanisms (2023)
- Two years into COVID-19 pandemic: Where are we? (2022)
- Collections
- Policies
- For Contributors
Articles
- Page Path
- HOME > J. Microbiol > Volume 63(4); 2025 > Article
-
Full article
Genetic insights into novel lysis suppression by phage CSP1 in Escherichia coli - Moosung Kim1,2, Sangryeol Ryu1,2,3,4,*
-
Journal of Microbiology 2025;63(4):e2501013.
DOI: https://doi.org/10.71150/jm.2501013
Published online: April 29, 2025
1Department of Food and Animal Biotechnology, College of Agriculture and Life Sciences, Seoul National University, Seoul 08826, Republic of Korea
2Department of Agricultural Biotechnology, College of Agriculture and Life Sciences, Seoul National University, Seoul 08826, Republic of Korea
3Research Institute of Agriculture and Life Sciences, College of Agriculture and Life Sciences, Seoul National University, Seoul 08826, Republic of Korea
4Center for Food and Bioconvergence, Seoul National University, Seoul 08826, Republic of Korea
- *Correspondence Sangryeol Ryu sangryu@snu.ac.kr
© The Microbiological Society of Korea
This is an Open Access article distributed under the terms of the Creative Commons Attribution Non-Commercial License (http://creativecommons.org/licenses/by-nc/4.0) which permits unrestricted non-commercial use, distribution, and reproduction in any medium, provided the original work is properly cited.
ABSTRACT
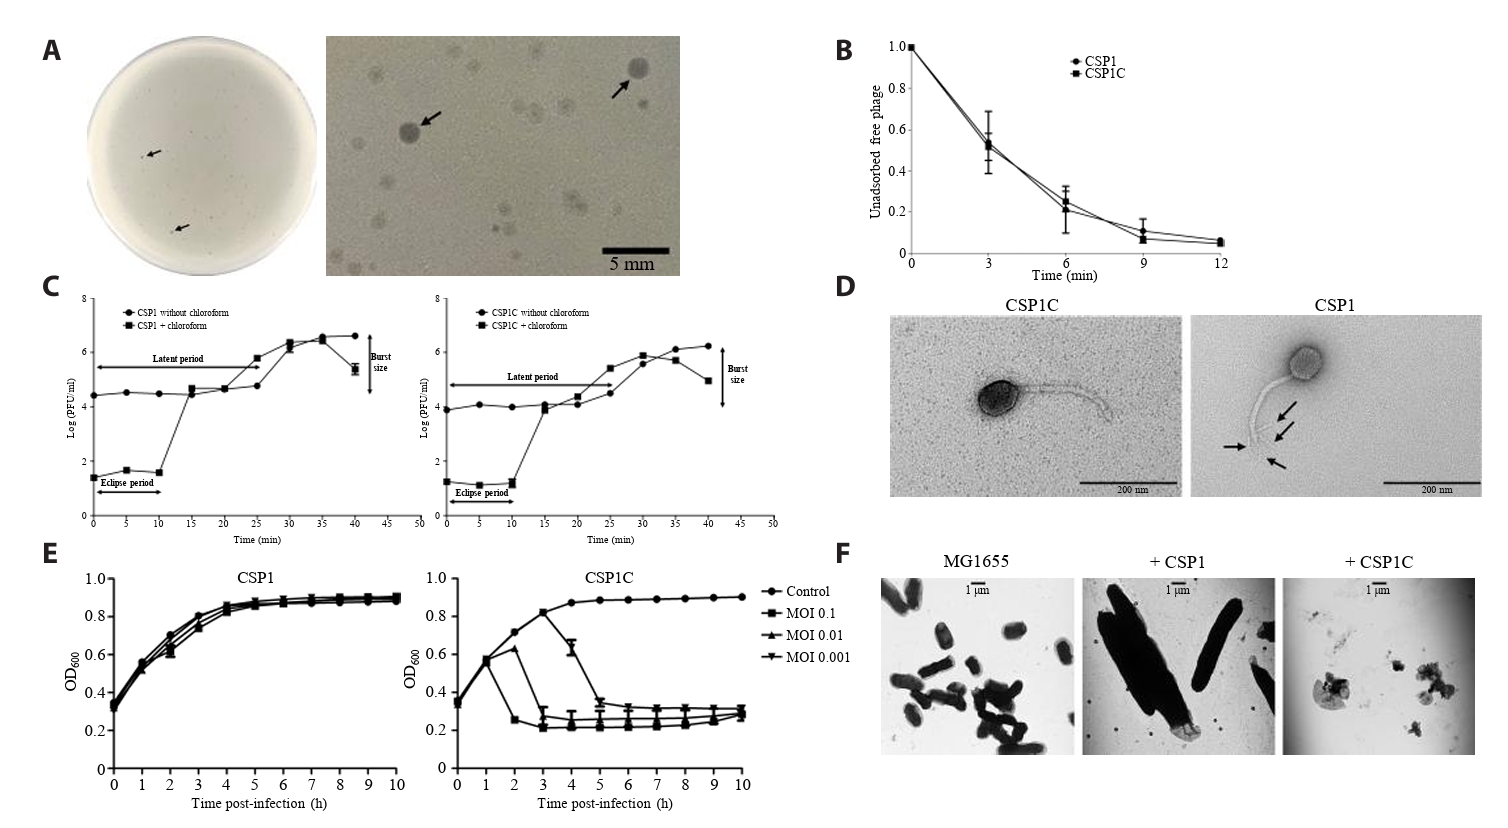
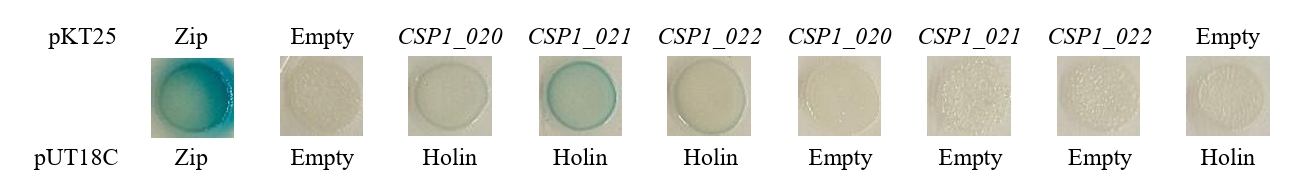
- Lysis inhibition (LIN) in bacteriophage is a strategy to maximize progeny production. A clear plaque-forming mutant, CSP1C, was isolated from the turbid plaque-forming CSP1 phage. CSP1C exhibited an adsorption rate and replication dynamics similar to CSP1. Approximately 90% of the phages were adsorbed to the host cell within 12 min, and both phages had a latent period of 25 min. Burst sizes were 171.42 ± 31.75 plaque-forming units (PFU) per infected cell for CSP1 and 168.94 ± 51.67 PFU per infected cell for CSP1C. Both phages caused comparable reductions in viable E. coli cell counts at a low multiplicity of infection (MOI). However, CSP1 infection did not reduce turbidity, suggesting a form of LIN distinct from the well-characterized LIN of T4 phage. Genomic analysis revealed that a 4,672-base pairs (bp) DNA region, encompassing part of the tail fiber gene, CSP1_020, along with three hypothetical genes, CSP1_021, CSP1_022, and part of CSP1_023, was deleted from CSP1 to make CSP1C. Complementation analysis in CSP1C identified CSP1_020, CSP1_021, and CSP1_022 as a minimal gene set required for the lysis suppression in CSP1. Co-expression of these genes in E. coli with holin (CSP1_092) and endolysin (CSP1_091) resulted in lysis suppression. Lysis suppression was abolished by disrupting the proton motive force (PMF), supporting their potential role as antiholin. Additionally, CSP1_021 directly interacts with holin, suggesting that it may function as an antiholin. These findings identify new genetic factors involved in lysis suppression in CSP1, providing broader insights into phage strategies for modulating host cell lysis.
Introduction
Materials and Methods
Results and Discussion
Acknowledgments
This research was supported by a grant of the Korea Health Technology R & D Project through the Korea Health Industry Development Institute (KHIDI), funded by the Ministry of Health & Welfare, Republic of Korea (grant number: RS-2023-KH136866). This work was supported by the Ministry of Education of the Republic of Korea and the National Research Foundation of Korea (NRF-2023R1A2C1006359).
Conflict of Interest
The authors have no relevant financial or non-financial interests to disclose.
Data Availability
The complete genome sequence of phage CSP1 and CSP1C has been deposited in GenBank under accession numbers KY982929 and PQ20298. Further inquiries can be directed to the corresponding author.
Supplementary Information
Table S5.
Table S6.
Table S7.
Table S8.
Fig. S1.
Fig. S2.


- Abdelkader K, Gutiérrez D, Latka A, Boeckaerts D, Drulis-Kawa Z, et al. 2022. The specific capsule depolymerase of phage PMK34 sensitizes Acinetobacter baumannii to serum killing. Antibiotics (Basel). 11(5): 677.ArticlePubMedPMC
- Abedon ST. 1992. Lysis of lysis-inhibited bacteriophage T4-infected cells. J Bacteriol. 174(24): 8073–8080. ArticlePubMedPMCLink
- Abedon ST. 2009. Bacteriophage intraspecific cooperation and defection. In Adams HT. (ed.), Contemporary trends in bacteriophage research, pp. 191–215, Nova Science Publishers.
- Abedon ST. 2019. Look who’s talking: T-even phage lysis inhibition, the granddaddy of virus-virus intercellular communication research. Viruses. 11(10): 951.ArticlePubMedPMC
- Abedon ST, Hyman P, Thomas C. 2003. Experimental examination of bacteriophage latent-period evolution as a response to bacterial availability. Appl Environ Microbiol. 69(12): 7499–7506. ArticlePubMedPMCLink
- Almagro Armenteros JJ, Tsirigos KD, Sønderby CK, Petersen TN, Winther O, et al. 2019. SignalP 5.0 improves signal peptide predictions using deep neural networks. Nat Biotechnol. 37(4): 420–423. ArticlePubMedPDF
- Attrill EL, Łapińska U, Westra ER, Harding SV, Pagliara S. 2023. Slow growing bacteria survive bacteriophage in isolation. ISME Commun. 3(1): 95.ArticlePubMedPMCPDF
- Bednarek A, Cena A, Izak W, Bigos J, Łobocka M. 2022. Functional dissection of P1 bacteriophage holin-like proteins reveals the biological sense of P1 lytic system complexity. Int J Mol Sci. 23(8): 4231.ArticlePubMedPMC
- Bi X, Liu LF. 1996. A replicational model for DNA recombination between direct repeats. J Mol Biol. 256(5): 849–858. ArticlePubMed
- Bzymek M, Saveson CJ, Feschenko VV, Lovett ST. 1999. Slipped misalignment mechanisms of deletion formation: in vivo susceptibility to nucleases. J Bacteriol. 181(2): 477–482. ArticlePubMedPMCLink
- Cahill J, Holt A, Theodore M, Moreland R, O'Leary C, et al. 2024. Spatial and temporal control of lysis by the lambda holin. mBio. 15(2): e0129023. ArticlePubMedLink
- Cahill J, Young R. 2019. Chapter two - phage lysis: multiple genes for multiple barriers. In Kielian M, Mettenleiter TC, Roossinck MJ. (eds.), Advances in virus research, Vol. 103, pp. 33–70. Academic Press.PMC
- Chen Y, Young R. 2016. The last r locus unveiled: T4 RIII is a cytoplasmic antiholin. J Bacteriol. 198(18): 2448–2457. ArticlePubMedPMCLink
- Dressman HK, Drake JW. 1999. Lysis and lysis inhibition in bacteriophage T4: rV mutations reside in the holin t gene. J Bacteriol. 181(14): 4391–4396. ArticlePubMedPMCLink
- Engelhardt T, Kallmeyer J, Cypionka H, Engelen B. 2014. High virus-to-cell ratios indicate ongoing production of viruses in deep subsurface sediments. ISME J. 8(7): 1503–1509. ArticlePubMedPMCPDF
- Gabler F, Nam SZ, Till S, Mirdita M, Steinegger M, et al. 2020. Protein sequence analysis using the MPI bioinformatics toolkit. Curr Protoc Bioinformatics. 72(1): e108. ArticlePubMedLink
- Groman NB. 1965. Factors in lysis and lysis inhibition by lambda bacteriophage. J Bacteriol. 90(6): 1563–1568. ArticlePubMedPMCLink
- Guo T, Xin Y, Zhang C, Kong J. 2018. A cytoplasmic antiholin is embedded in frame with the holin in a Lactobacillus fermentum bacteriophage. Appl Environ Microbiol. 84(6): e02518–02517. ArticlePubMedPMCLink
- Hays SG, Seed KD. 2020. Dominant Vibrio cholerae phage exhibits lysis inhibition sensitive to disruption by a defensive phage satellite. eLife. 9: e53200. ArticlePubMedPMCPDF
- Heagy FC. 1950. The effect of 2,4-dinitrophenol and phage T2 on Escherichia coli B. J Bacteriol. 59(3): 367–373. ArticlePubMedPMCLink
- Hutinet G, Kot W, Cui L, Hillebrand R, Balamkundu S, et al. 2019. 7-Deazaguanine modifications protect phage DNA from host restriction systems. Nat Commun. 10: 5442.ArticlePubMedPMCPDF
- Hvid U, Mitarai N. 2024. Competitive advantages of T-even phage lysis inhibition in response to secondary infection. PLoS Comput Biol. 20(7): e1012242. ArticlePubMedPMC
- Jiang W, Bikard D, Cox D, Zhang F, Marraffini LA. 2013. RNA-guided editing of bacterial genomes using CRISPR-Cas systems. Nat Biotechnol. 31(3): 233–239. ArticlePubMedPMCPDF
- Karimova G, Ullmann A, Ladant D. 2001. Protein-protein interaction between Bacillus stearothermophilus tyrosyl-tRNA synthetase subdomains revealed by a bacterial two-hybrid system. J Mol Microbiol Biotechnol. 3(1): 73–82. PubMed
- Kim M, Kim M, Ryu S. 2024. Identification of amino acid residue in the Cronobacter sakazakii LamB responsible for the receptor compatibility of polyvalent coliphage CSP1. J Virol. 98(10): e00676–24. ArticlePubMedPMCLink
- Knecht LE, Veljkovic M, Fieseler L. 2020. Diversity and function of phage encoded depolymerases. Front Microbiol. 10: 2949.ArticlePubMedPMC
- Kongari R, Rajaure M, Cahill J, Rasche E, Mijalis E, et al. 2018. Phage spanins: diversity, topological dynamics and gene convergence. BMC Bioinformatics. 19: 326.ArticlePubMedPMCPDF
- Krieger IV, Kuznetsov V, Chang JY, Zhang J, Moussa SH, et al. 2020. The structural basis of T4 phage lysis control: DNA as the signal for lysis inhibition. J Mol Biol. 432(16): 4623–4636. ArticlePubMedPMC
- Krogh A, Larsson B, von Heijne G, Sonnhammer EL. 2001. Predicting transmembrane protein topology with a hidden Markov model: application to complete genomes. J Mol Biol. 305(3): 567–580. PubMed
- Lee HS, Choi S, Shin H, Lee JH, Choi SH. 2014. Vibrio vulnificus bacteriophage SSP002 as a possible biocontrol agent. Appl Environ Microbiol. 80(2): 515–524. ArticlePubMedPMCLink
- Leiman PG, Battisti AJ, Bowman VD, Stummeyer K, Mühlenhoff M, et al. 2007. The structures of bacteriophages K1E and K1-5 explain processive degradation of polysaccharide capsules and evolution of new host specificities. J Mol Biol. 371(3): 836–849. ArticlePubMed
- Leprince A, Mahillon J. 2023. Phage adsorption to Gram-positive bacteria. Viruses. 15(1): 196.ArticlePubMedPMC
- Mehner-Breitfeld D, Schwarzkopf JMF, Young R, Kondabagil K, Brüser T. 2021. The phage T4 antiholin RI has a cleavable signal peptide, not a SAR domain. Front Microbiol. 12: 712460.ArticlePubMedPMC
- Meng LH, Ke F, Zhang QY, Zhao Z. 2022. Functional analysis of the endopeptidase and holin from Planktothrix agardhii cyanophage PaV-LD. Front Microbiol. 13: 849492.ArticlePubMedPMC
- Moussa SH, Kuznetsov V, Tran TAT, Sacchettini JC, Young R. 2012. Protein determinants of phage T4 lysis inhibition. Protein Sci. 21(4): 571–582. ArticlePubMedPMCLink
- Rajaure M, Berry J, Kongari R, Cahill J, Young R. 2015. Membrane fusion during phage lysis. Proc Natl Acad Sci USA. 112(17): 5497–5502. ArticlePubMedPMC
- Sambrook J, Fritsch EF, Maniatis T. 1989. Molecular cloning: a laboratory manual, 2nd ed. Cold Spring Harbor Laboratory Press, USA.
- Schwarzkopf JMF, Mehner-Breitfeld D, Brüser T. 2024. A dimeric holin/antiholin complex controls lysis by phage T4. Front Microbiol. 15: 1419106.ArticlePubMedPMC
- Slavcev RA, Hayes S. 2003. Blocking the T4 lysis inhibition phenotype. Gene. 321: 163–171. ArticlePubMed
- Sonnhammer EL, von Heijne G, Krogh A. 1998. A hidden Markov model for predicting transmembrane helices in protein sequences. Proc Int Conf Intell Syst Mol Biol. 6: 175–182. PubMed
- Thomas R, Berdjeb L, Sime-Ngando T, Jacquet S. 2011. Viral abundance, production, decay rates and life strategies (lysogeny versus lysis) in Lake Bourget (France). Environ Microbiol. 13(3): 616–630. ArticlePubMed
- Thöneböhn S, Fischer D, Kreiling V, Kemmler A, Oberheim I, et al. 2024. Identifying components of the Shewanella phage LambdaSo lysis system. J Bacteriol. 206(6): e0002224. PubMed
- Tran TAT, Struck DK, Young R. 2007. The T4 RI antiholin has an N-terminal signal anchor release domain that targets it for degradation by DegP. J Bacteriol. 189(21): 7618–7625. ArticlePubMedPMCLink
- Williamson KE, Corzo KA, Drissi CL, Buckingham JM, Thompson CP, et al. 2013. Estimates of viral abundance in soils are strongly influenced by extraction and enumeration methods. Biol Fertil Soils. 49(7): 857–869. ArticlePDF
- Wu Y, Wang R, Xu M, Liu Y, Zhu X, et al. 2019. A novel polysaccharide depolymerase encoded by the phage SH-KP152226 confers specific activity against multidrug-resistant Klebsiella pneumoniae via biofilm degradation. Front Microbiol. 10: 2768.ArticlePubMedPMC
- Wu Z, Zhang Y, Xu X, Ahmed T, Yang Y, et al. 2021. The holin-endolysin lysis system of the OP2-like phage X2 infecting Xanthomonas oryzae pv. oryzae. Viruses. 13(10): 1949.Article
- Young R. 1992. Bacteriophage lysis: mechanism and regulation. Microbiol Rev. 56(3): 430–481. ArticlePubMedPMCLink
- Young R. 2014. Phage lysis: three steps, three choices, one outcome. J Microbiol. 52(3): 243–258. ArticlePubMedPMCPDF
- Young RF, White RL. 2008. Lysis of the host by Bacteriophage. In Mahy BWJ, Van Regenmortel MHV. (eds.), Encyclopedia of virology, 3rd edn, pp. 248–258, Academic Press.
- Zhang M, Wang Y, Chen J, Hong X, Xu X, et al. 2022. Identification and characterization of a new type of holin-endolysin lysis cassette in Acidovorax oryzae phage AP1. Viruses. 14(2): 167.ArticlePubMedPMC
References
Supplementary Information
References
Citations
- Characterization and genome analyses of the novel phages targeting extraintestinal Escherichia coli clones ST131 and ST410
Md Shamsuzzaman, Yoon-Jung Choi, Shukho Kim, Jungmin Kim
International Microbiology.2025; 28(7): 2233. CrossRef - Optical Density-Based Methods in Phage Biology: Titering, Lysis Timing, Host Range, and Phage-Resistance Evolution
Stephen T. Abedon
Viruses.2025; 17(12): 1573. CrossRef
 ePub Link
 Cite this Article

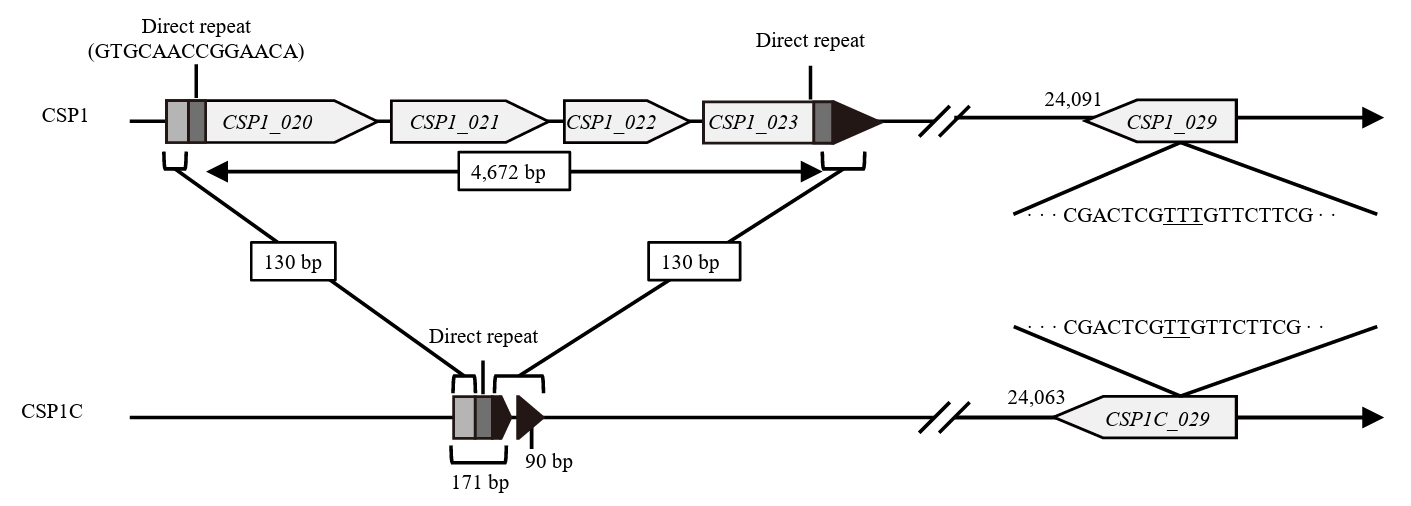

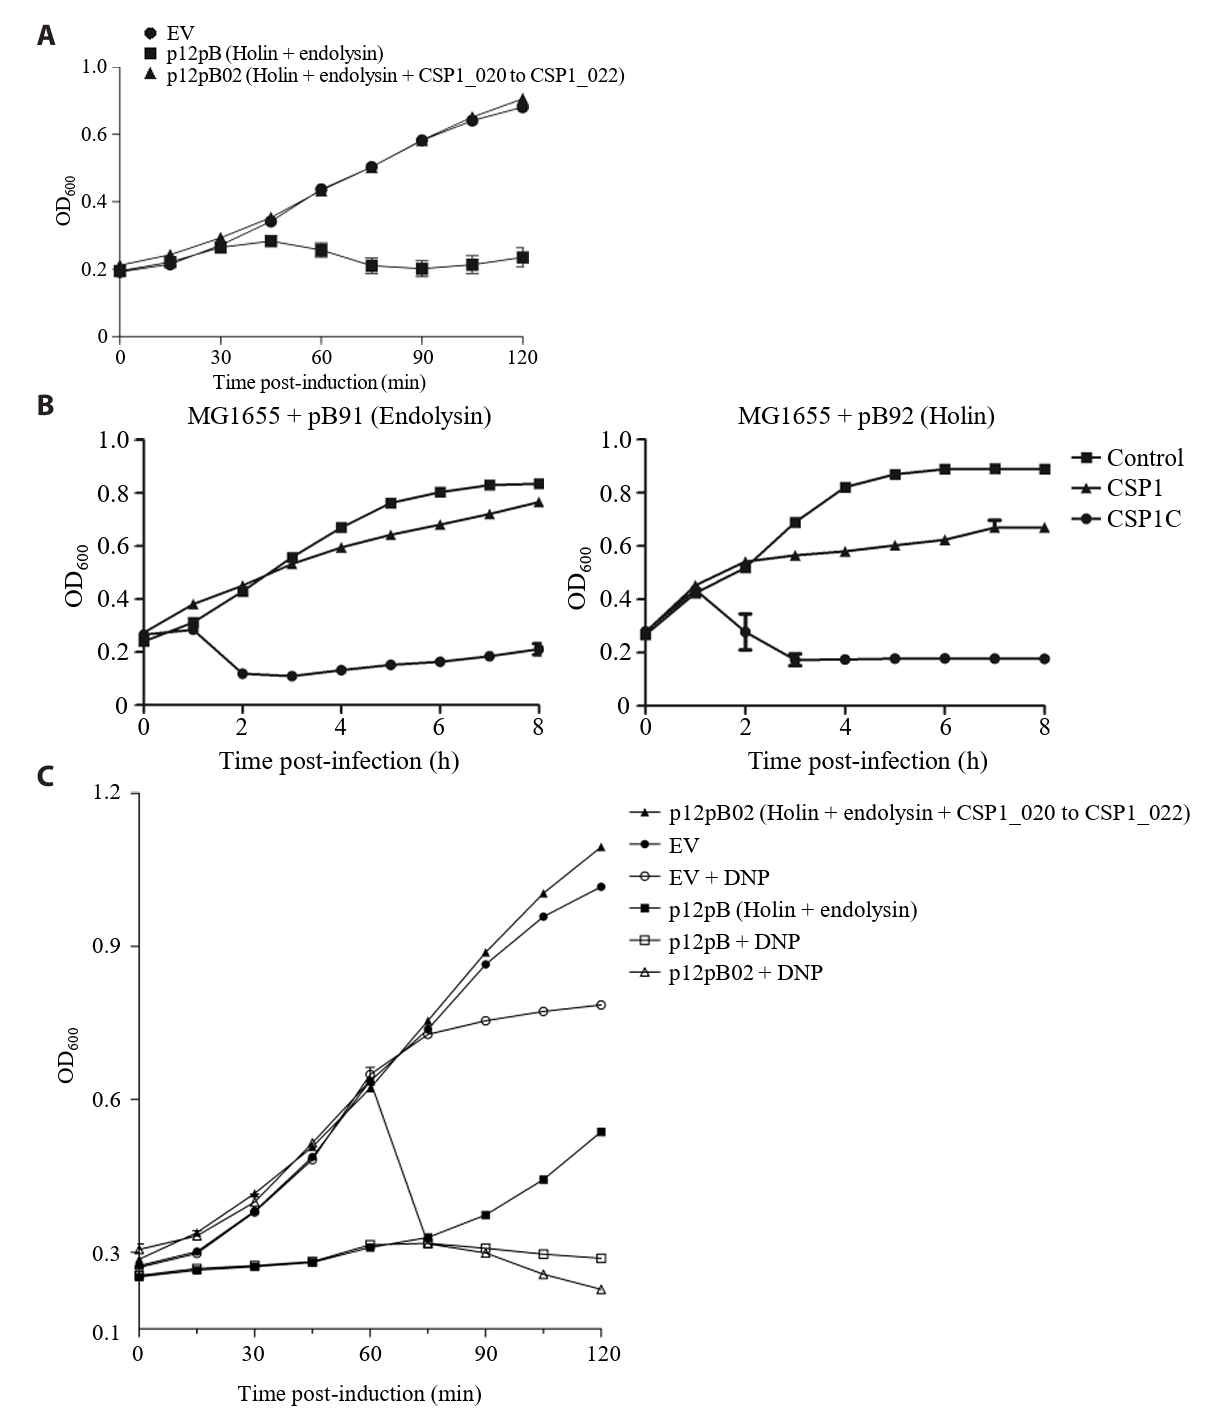


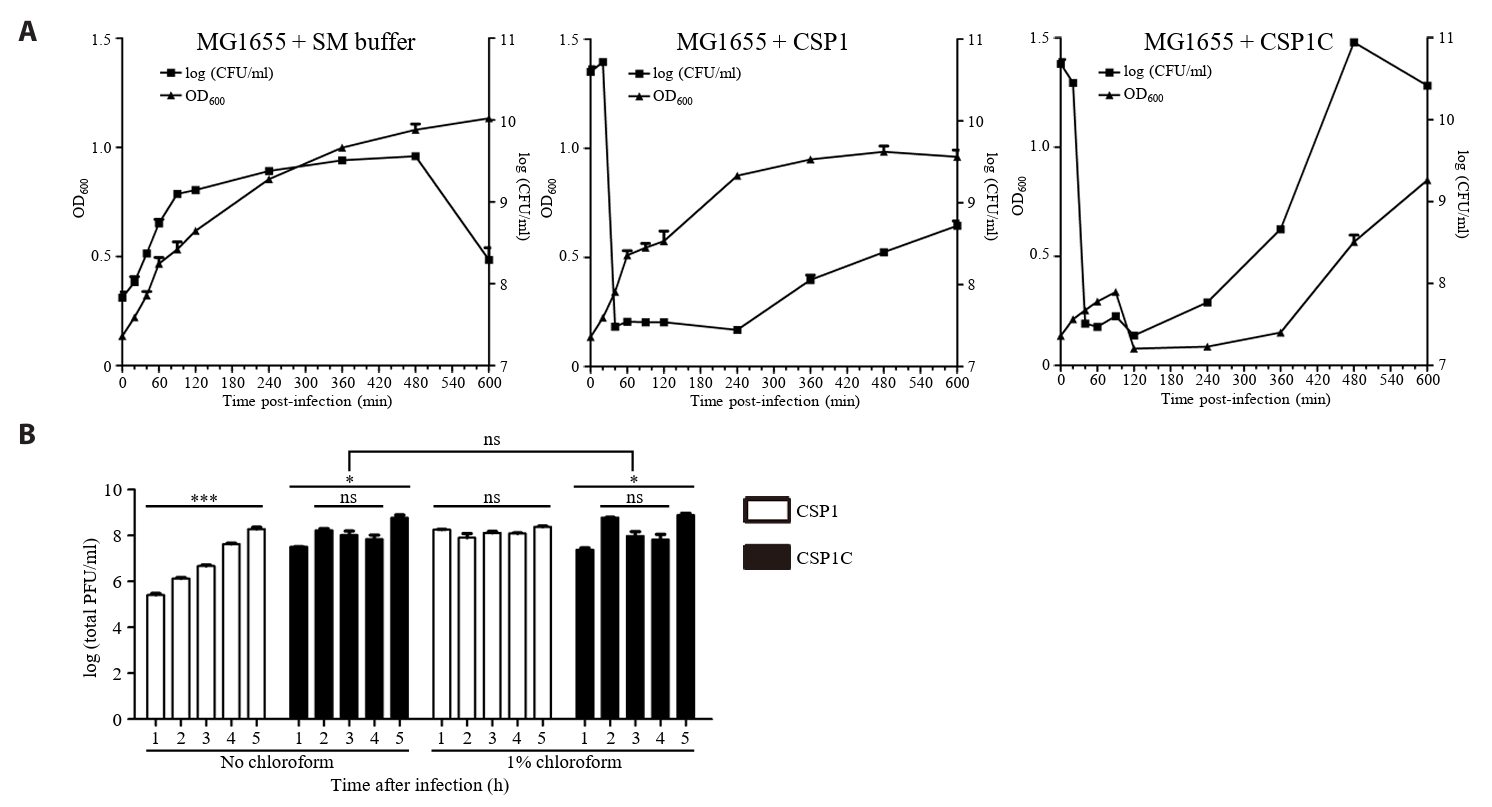


Fig. 1.
Fig. 2.
Fig. 3.
Fig. 4.
Fig. 5.
Fig. 6.
| Gene | Product | Mutation |
|---|---|---|
| CSP1_020 | Tail fiber protein | 2,951 bp from 3′ end deletion |
| CSP1_021 | Hypothetical protein | Gene knockout |
| CSP1_022 | Hypothetical protein | |
| CSP1_023 | Hypothetical protein | 514 bp from 5′ end deletion |
| CSP1_029 | Hypothetical protein | 24,140T deletion |
| Intergenic region | None | 49,132A addition |
| 49,318G to A substitution | ||
| 52,083T to C substitution | ||
| 60,173T to C substitution |
Table 1.
TOP

