ABSTRACT
- BipA is a conserved ribosome-associated GTPase that supports bacterial stress adaptation. It participates in 50S ribosome assembly and envelope stress responses; however, it is not known whether both functions depend on its GTPase activity. In this study, we investigated Escherichia coli strains carrying chromosomal D74A or N128D substitutions in the conserved GTPase motifs of BipA. Both mutants displayed severe cold-sensitive growth defects that were similar to those of the ΔbipA strain. At low temperatures, 50S ribosome assembly was defective and immature ribosomal particles accumulated. Ribosome-binding analysis revealed that the mutant BipA had a lower association with ribosomal fractions. The mutants exhibited altered lipopolysaccharide profiles and envelope phenotypes, including increased capsule production, reduced biofilm formation and motility, and increased cell width and length. These phenotypes were most notable at low temperatures, indicating activation of the Rcs (Regulator of Capsule Synthesis) phosphorelay. We next examined the effects of BipA abundance on cellular physiology. BipA expression was influenced by both start-codon identity and the downstream coding context. BipA overexpression impaired growth and induced pronounced cell elongation at both optimal and low temperatures, indicating that proper control of BipA abundance is important for cellular homeostasis. Furthermore, the increased susceptibility of the ΔbipA strain to ampicillin at low temperatures suggested an association between BipA and peptidoglycan homeostasis. Together, these findings suggest that BipA GTPase function is required to maintain ribosome biogenesis and envelope homeostasis during cold adaptation, and that proper control of BipA abundance is also important for maintaining cellular physiology.
-
Keywords: GTPase, BipA, CRISPR/Cas9, cold stress, ribosome assembly, cell envelope
Introduction
Bacterial survival under fluctuating environmental conditions requires the coordinated regulation of protein synthesis, cell-envelope integrity, and stress-responsive signaling pathways. Because the bacterial envelope is the primary interface between a cell and its environment, perturbations affecting envelope biogenesis often induce extensive physiological responses that influence growth, adaptation, and virulence. In Gram-negative bacteria, one of the major envelope stress-response systems is the Regulator of Capsule Synthesis (Rcs) phosphorelay pathway, a complex signaling network that senses perturbations in the outer membrane and regulates a variety of cellular processes, including capsule synthesis, exopolysaccharide production, biofilm formation, motility, and envelope maintenance. Although the molecular mechanisms linking envelope stress to translational regulation are not completely understood, there is increasing evidence to suggest that the conserved GTPase BipA has an important role in coordinating these processes.
BipA (also known as TypA) is a highly conserved ribosome-associated GTPase present in a wide range of bacterial species. Unlike many housekeeping factors that are required for growth under standard laboratory conditions, BipA is particularly important under environmental stress. In Escherichia coli, the deletion of bipA causes notable cold-sensitive growth defects; however, in several pathogenic bacteria, BipA contributes to stress adaptation, host colonization, and virulence (Choi et al., 2025; Crane et al., 2021). These observations suggest that BipA acts as an adaptive regulator that enables bacterial cells to maintain physiological homeostasis under challenging environmental conditions.
The most extensively characterized role of BipA is associated with ribosome biogenesis. The efficient assembly of the 50S ribosomal subunit requires the precise coordination of rRNA maturation, ribosomal protein incorporation, and the structural remodeling of assembly intermediates. Low temperatures, which slow RNA folding and ribosome maturation, impose a significant burden on this process. Consequently, bipA-deficient cells accumulate immature 50S particles and display reduced formation of functional 70S ribosomes, which result in impaired growth (Choi and Hwang, 2018). Genetic studies have demonstrated that the overproduction of the ribosomal protein L20 partially suppresses these defects, suggesting that BipA participates in the late stages of large subunit assembly (Choi et al., 2020b).
Recent studies have confirmed that the physiological functions of BipA extend beyond ribosome assembly. Transcriptomic and genetic analyses indicate that BipA influences many genes associated with cell-envelope biogenesis and surface polysaccharide production. Notably, the deletion of bipA enhanced capsule synthesis and altered colony morphology in E. coli; such changes are typically associated with the activation of the Rcs phosphorelay system (Choi et al., 2020a). Similarly, BipA deficiency has been linked to the increased expression of Rcs-regulated genes that are involved in extracellular polysaccharide production and envelope stress adaptation. These findings suggest that the disruption of BipA function may generate envelope-associated signals that stimulate the Rcs pathway, triggering compensatory responses aimed at preserving cell surface integrity. Additional insights have emerged from suppressor analyses of bipA-deficient strains. Regulatory proteins, such as YebC and NhaR, partially restore growth defects through distinct mechanisms (the regulation of surface polysaccharides and the transcription of ribosomal RNA, respectively) (Choi et al., 2020a, 2023). These findings support the central position of BipA at the interface of translation, envelope homeostasis, and stress signaling. Moreover, studies in Salmonella enterica have demonstrated that BipA participates in both ribosome assembly and surface structure biogenesis, reinforcing the concept that BipA coordinates intracellular translational capacity with extracellular envelope remodeling (Choi et al., 2025). Although our understanding of BipA biology has progressed substantially, the molecular mechanisms connecting ribosome assembly, Rcs-dependent envelope stress responses, and cell surface biogenesis remain poorly understood. By determining how BipA influences these interconnected pathways, we hope to gain important insights into bacterial stress adaptation and novel regulatory mechanisms that couple translational status to envelope homeostasis in Gram-negative bacteria. In this work, we generated chromosomal bipA mutants carrying D74A or N128D substitutions in the conserved GTPase motifs of BipA and examined the growth, ribosome assembly, ribosome association, and envelope-associated phenotypes in E. coli MG1655. In addition, we studied BipA overexpression to determine whether BipA GTPase activity and protein abundance were important for cold adaptation, ribosome biogenesis, and envelope homeostasis.
Materials and Methods
Bacterial strains and growth conditions
The E. coli strains used in this study are listed in Table 1. E. coli cultures were grown in Luria–Bertani (LB) medium at either 37°C or 18°C, supplemented as required with ampicillin (100 μg/ml), chloramphenicol (50 μg/ml), kanamycin (50 μg/ml), or spectinomycin (50 μg/ml). For the ampicillin susceptibility test, the overnight cultures were diluted 1:200 into fresh LB medium containing the indicated concentrations of ampicillin. Growth was monitored by measuring the optical density of the culture solution at 600 nm (OD600) using a BioTek Epoch2 microplate spectrophotometer (Agilent Technologies).
Strain construction by CRISPR/Cas9
Genome editing of E. coli MG1655 was performed using the no-SCAR CRISPR/Cas9-mediated recombineering system (Reisch and Prather, 2015). Cells harboring the pCas9cr4 plasmid were transformed with a pKDsgRNA plasmids targeting the bipA locus. For recombineering, λ-Red recombinase was induced by the addition of 0.2% L-arabinose. Electrocompetent cells were subsequently prepared and transformed using phosphorothioate-modified donor oligonucleotides encoding a C-terminal FLAG-tag sequence, bipAD74A or bipAN128D. The transformants were recovered in LB medium and plated on LB agar supplemented with chloramphenicol (30 μg/ml), spectinomycin (50 μg/ml), and anhydrotetracycline (aTc, 0.1 μg/ml) to select for successfully edited cells. After selection, the pKDsgRNA plasmid was cured by incubation at 43°C, and loss of the plasmid was confirmed by sensitivity to antibiotics. Edited clones were screened using colony PCR and verified using DNA sequencing. Subsequently, the pCas9cr4 plasmid was removed through secondary transformation with the pKDsgRNA-p15a plasmid in the presence of aTc. The curing plasmid was then eliminated by incubation at 43°C, and plasmid loss was confirmed by sensitivity to antibiotics.
Plasmid construction
Using pACYC184BipA (Choi and Hwang, 2018) as a template, FLAG-tagged constructs were generated by site-directed mutagenesis PCR using the primers listed in Table 2. FLAG sequences were introduced at either the N- or C-terminus of BipA, yielding pACYC184F-BipA and pACYC184BipA-F, respectively. Constructs with an ATG start codon were then generated by replacing the native GTG start codon in the corresponding pACYC184BipA constructs, yielding pACYC184BipAATG, pACYC184F-BipAATG, and pACYC184BipAATG-F. The same inserts as in pACYC184 were ligated into the SmaI site of pUC19, yielding pUC19BipA, pUC19BipAATG, pUC19F-BipA, pUC19F-BipAATG, pUC19BipA-F, and pUC19BipAATG-F. The D74A point mutation was introduced into bipA by site-directed mutagenesis PCR using pACYC184BipA as the template. The resulting bipA insert was digested using NdeI and BamHI restriction enzymes and ligated into the pET28a vector, yielding pET28BipAD74A. The wild-type bipA fragment was also digested with NdeI and BamHI and then ligated into the corresponding sites of the isopropyl β-D-thiogalactopyranoside (IPTG)–inducible vector pIN-A, generating pINBipA. Then, CRISPR/Cas9-mediated chromosomal editing was performed using the no-SCAR system. For each edit, an sgRNA target was selected from the unedited bipA sequence by identifying an 5′-NGG-3′ PAM (Protospacer adjacent motif) near the desired mutation or insertion site and choosing the adjacent 20-bp target sequence. The pKDsgRNA plasmids were constructed using whole-plasmid PCR with the ptetR primer and target-specific primers containing the selected 20-bp target sequences. The PCR products were then self-ligated to yield pKDsg-BipA, pKDsg-BipAD74A, and pKDsg-BipAN128D. Donor oligonucleotides, containing the desired FLAG insertion or point mutation together with the surrounding bipA sequences, were synthesized. When necessary, additional nucleotide changes that did not alter the amino acid sequence were included to disrupt the original sgRNA target sequence and prevent re-cleavage after recombination. Phosphorothioate-modified donor oligonucleotides were used for λ-Red–mediated recombineering.
Protein overexpression and purification
E. coli BL21(DE3) cells were transformed with pET28a-derived plasmids and grown at 37°C until the OD600 was 0.5–0.6. Protein expression was induced by overnight incubation of the cells at 18°C with IPTG to a final concentration of 0.5 mM. To harvest the induced cells, the culture solutions were centrifuged at 4°C, washed using 10 mM Tris-HCl (pH 6.8), and centrifuged again. To purify the wild-type and mutant His6-tagged BipA proteins, cell pellets were resuspended in 20 ml of Buffer A (20 mM Tris-HCl [pH 7.5], 200 mM NaCl, 2 mM β-mercaptoethanol [BME], and 5 mM imidazole) and lysed by sonication. The insoluble fraction was removed by centrifugation at 10,000 × g for 20 min at 4°C, and the supernatant was further clarified by ultracentrifugation at 70,000 × g for 1 h at 4°C using a Beckman Type 70 Ti rotor to remove membrane fractions. The soluble fraction was applied to a Ni-NTA agarose resin (Qiagen) column pre-equilibrated with Buffer A. After the sample was loaded, the resin was washed with 40 column volumes of Buffer A containing 20 mM imidazole, 1 column volume of Buffer A containing 40 mM imidazole, and 1 column volume of Buffer A containing 60 mM imidazole. Bound proteins were eluted in Buffer A containing 250 mM imidazole. Eluted proteins were dialyzed overnight in 1.5 L of Buffer A without imidazole.
GTPase assay
GTP hydrolysis was quantified through the release of inorganic phosphate using a Malachite Green Phosphate Assay Kit (BioAssay Systems). The enzymatic hydrolysis was performed at 37°C for 2 h in a 100 μl reaction volume containing 20 mM Tris-HCl (pH 7.5), 400 mM KCl, 5 mM MgCl2, 5 mM BME, 1 mM GTP, and 1 μM protein. The reaction was terminated by incubating 80 μl of the sample with 20 μl of Working Reagent at room temperature for 30 min to allow for color development. The optical absorbance at 620 nm was measured using a Multiskan GO microplate spectrophotometer (Thermo Fisher Scientific).
Sucrose density gradient sedimentation
Wild-type, bipA deletion, and GTPase-defective mutant strains were grown in LB medium or LB supplemented with kanamycin at 37°C or 18°C until the culture solutions reached an OD600 of 0.5. Subsequently, the cultures were treated with chloramphenicol at a final concentration of 0.1 mg/ml and then incubated for a further 3 min at the respective temperature. In total, 50 ml of cells was harvested by centrifugation at 3,500 rpm for 10 min and resuspended in 0.5 ml of Buffer BP (20 mM Tris-HCl [pH 7.5], 10 mM MgCl2, 100 mM NH4Cl, and 5 mM BME) for polysome profiling or Buffer BS (20 mM Tris-HCl [pH 7.5], 1 mM MgCl2, 100 mM NH4Cl, and 5 mM BME) for subunit profiling. The cells were lysed by treatment with 5 μl of 10 mg/ml lysozyme followed by three freeze–thaw cycles. For the analysis of nucleotide-dependent ribosome association, GMPPNP was added to the resuspended cell pellets to a final concentration of 100 μM immediately before freeze–thaw lysis. Lysates were clarified using centrifugation. For polysome analysis, 24 A260 units of RNA were loaded onto a 10 ml 5%–40% sucrose gradient prepared in Buffer BP; for subunit profiling, 8 A260 units of RNA were loaded onto a 10 ml 5%–25% sucrose gradient prepared in Buffer BS. The loaded gradients were centrifuged at 4°C for 2.5 h (polysome profiling) or 3.5 h (subunit profiling) at 37,000 rpm using a Beckman SW 41 Ti rotor. After centrifugation, gradient eluates were collected in 400-μl fractions using an ÄKTA FPLC system (Amersham Pharmacia Biotech). The absorbance at 254 nm was monitored continuously during fractionation.
Western blotting analysis
Following SDS–PAGE, proteins were transferred to PVDF membranes (Cytiva) using a semidry transfer system, as described previously (Choi et al., 2025). The membranes were incubated overnight at 4°C with anti-BipA (1:10,000 dilution in 3% skim milk in Tween–Tris-buffered saline [TTBS]) or anti-FLAG (1:5,000 dilution in 1% BSA in TTBS) primary antibodies. After the overnight incubation, the membranes were washed with TTBS and incubated with an alkaline phosphatase–conjugated anti-rabbit secondary antibody at a dilution of 1:10,000 in 3% skim milk in TTBS for 1 h at 4°C. After the membranes were washed in TTBS, protein signals were visualized by the application of 5-bromo-4-chloro-3-indolyl-phosphate and nitroblue tetrazolium. Western blot band intensities were quantified using ImageJ. For the anti-BipA immunoblots, the intensity of each BipA band was measured after background subtraction. Relative levels of BipA were then calculated by setting the wild-type sample to 1.0.
Lipopolysaccharide extraction and visualization
Colonies grown on LB agar plates at 37°C for 16 h or at 18°C for 1 week were scraped into phosphate-buffered saline (PBS, pH 7.4). Cells equivalent to 10 ml of culture at an OD600 of 0.5 were collected by centrifugation. Lipopolysaccharide (LPS) extraction was performed as described previously (Choi et al., 2025). Briefly, the resuspended cells were mixed with an equal volume of phenol and then heated at 65°C for 15 min. The samples were cooled to room temperature and centrifuged at 13,000 rpm for 20 min. The aqueous phase was collected, from which LPS was precipitated using ethanol. The resulting pellet was resuspended in 20 mM Tris-HCl (pH 6.8) and treated sequentially with DNase I, RNase A, and Proteinase K. LPS was re-extracted using ethanol precipitation and then resuspended in 40 μl of distilled water. Samples were analyzed using 16% tricine-SDS–PAGE and visualized using silver staining.
Crystal violet staining of the biofilm
Wild-type, bipA deletion, and GTPase-defective mutant strains were grown overnight in LB medium or LB medium supplemented with kanamycin at 37°C. The culture medium was diluted 1:200 into 500 μl of fresh LB medium in 48-well plates and incubated at 37°C for 24 h or at 18°C for 54 h with shaking at 200 rpm. After incubation, each well was gently rinsed with PBS (pH 7.4) and stained with 0.1% crystal violet. After three washes with distilled water, the bound dye was solubilized in 95% ethanol, and the absorbance at 540 nm was measured using a Multiskan GO microplate spectrophotometer (Thermo Fisher Scientific).
Swimming motility assay
Cultures grown to an OD600 of 0.5 at 37°C were concentrated 10-fold by centrifugation, and 5 μl of the suspension was inoculated onto LB plates containing 0.3% Bacto agar for the swimming assay. The LB plates were incubated at 37°C for 18 h or 18°C for 144 h. Migration was assessed by measuring the distance traveled from the inoculation site and the plates were photographed using a Quantica 500 imaging system (BIOAVLEE).
Microscopic observation of cells and nucleoids
Overnight cultures were diluted into fresh LB medium and incubated at 37°C or 18°C until the OD600 reached 0.5–0.6. The cells were pelleted by centrifugation, washed once with 0.85% NaCl solution, and resuspended in an appropriate volume of 0.85% NaCl. Then, 5 μl of the suspension was spread onto a glass slide and dried at room temperature. Methanol was applied to the samples for fixation and the fixed samples were dried and then washed with tap water. After drying, 5 μl of 4′,6-diamidino-2-phenylindole (DAPI) solution (1 μg/ml in distilled water) was applied to the samples, and coverslips were mounted. The samples were incubated in the dark at room temperature for 5 min and observed using a ZEISS Imager M2 microscope equipped with a 100× oil-immersion objective. Images were acquired using ZEN imaging software (ZEISS). Cell length and width were quantified from bright-field microscopy images using ImageJ and MicrobeJ. Incorrectly segmented, overlapping, and out-of-focus cells were excluded. Cell size measurements were exported and used for statistical analysis.
Statistical analysis
Statistical analyses were performed using GraphPad Prism. Data are presented as the mean ± standard deviation (SD) of three independent experiments unless otherwise specified. Cell dimensions were measured from 100 cells per strain from representative experiments. Statistical significance was determined using one-way or two-way analysis of variance (ANOVA) followed by Dunnett’s multiple comparison test. The two-way ANOVA model included interaction effects between factors. The following significance levels were defined: NS (not significant), ∗p < 0.05, ∗∗p < 0.01, ∗∗∗p < 0.001.
Results
Cold-sensitive phenotypes of the bipAD74A and bipAN128D mutants
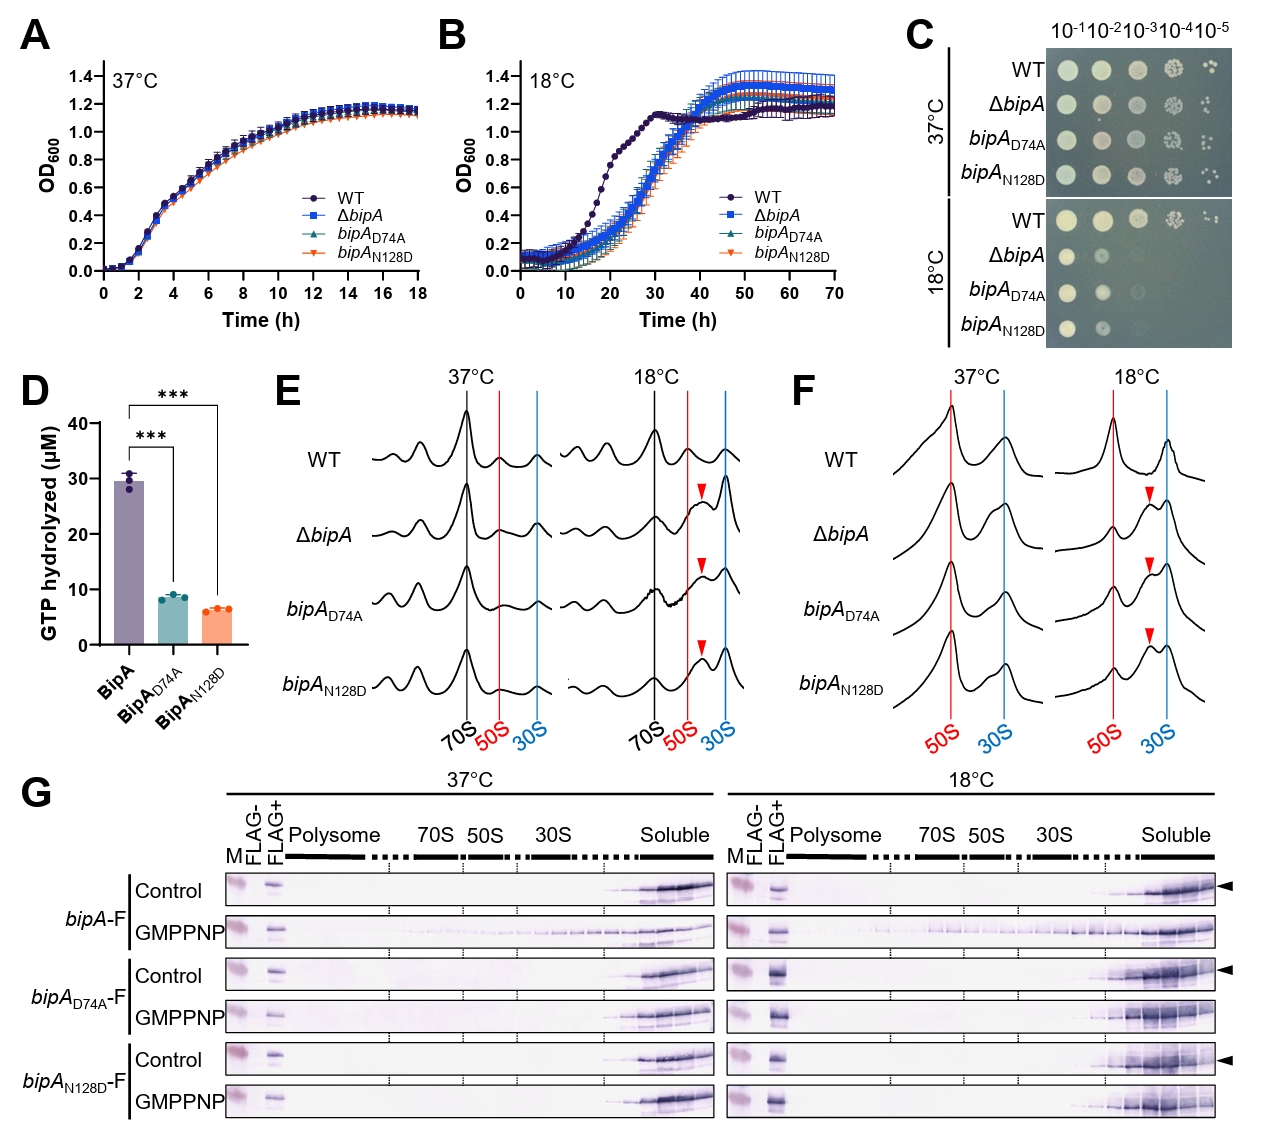
BipA has been shown to be required for normal growth at low temperatures and for the proper assembly of the 50S ribosomal subunit (Choi and Hwang, 2018). Moreover, BipA has been proposed to function in a GTP-dependent manner (Choi and Hwang, 2018). Consistent with this proposal, the previously characterized plasmid-borne BipAN128D mutant, which carries a substitution in the G4 (NKXD) motif responsible for guanine nucleotide recognition, exhibits a similar phenotype to the ΔbipA strain, which includes cold-sensitive growth and impaired ribosome association (Choi and Hwang, 2018). However, it is still unclear whether defective GTP hydrolysis is sufficient to compromise BipA function under low-temperature conditions. To answer this question, we used CRISPR/Cas9-mediated genome editing to generate a chromosomal bipA point mutant, bipAD74A, in addition to bipAN128D. The conserved Asp74 residue is located within the switch II/G3 (DXXG) motif, which is widely implicated in Mg2+-dependent GTP hydrolysis in GTPases (Yim et al., 2003). Thus, the comparison of these two chromosomal mutants enabled us to isolate the functional contributions of guanine nucleotide recognition and GTP hydrolysis to BipA activity. First, we examined whether mutations in the BipA GTPase-domain reproduced the growth phenotype of the ΔbipA strain. At 37°C, growth of the bipAD74A and bipAN128D mutants was similar to that of both the wild-type and ΔbipA strains (Fig. 1A). In contrast, at 18°C, there were pronounced growth defects in both mutants, similar to the defects observed for the ΔbipA strain (Fig. 1B). Consistent with this, spotting assays showed that growth of the ΔbipA, bipAD74A, and bipAN128D strains was severely impaired at 18°C but not at 37°C (Fig. 1C). To determine whether these low-temperature growth defects were rescued by wild-type BipA, we performed complementation analysis using a pACYC184BipA expression construct. The expression of wild-type BipA restored the growth of the ΔbipA, bipAD74A, and bipAN128D strains at 18°C while growth of the corresponding empty-vector controls remained defective (Fig. S1A–S1C). Western blotting analysis using an anti-BipA antibody confirmed the expression of BipA from wild-type and mutant strains at both 18°C and 37°C (Fig. S1D). To determine whether the observed growth defects were associated with impaired BipA GTPase activity, we purified wild-type and mutant BipA proteins and measured their in vitro GTP hydrolysis activities. BipAD74A and BipAN128D exhibited markedly lower GTP hydrolysis activity than wild-type BipA (Fig. 1D). Together, these results demonstrate that mutations disrupting either GTP hydrolysis or guanine nucleotide recognition can impair BipA GTPase activity and are associated with cold-sensitive growth. Therefore, we also investigated whether these growth defects were accompanied by defects in ribosome assembly. Both polysome and ribosomal subunit profiling revealed consistent ribosome profiles among all strains grown at 37°C (Fig. 1E and 1F). In contrast, in strains grown at 18°C, the ribosomal profiles of the ΔbipA, bipAD74A, and bipAN128D mutants differed from that of the wild-type strain. Specifically, these strains showed a reduced peak for the 50S subunit, an increased peak for the 30S subunit, and the accumulation of aberrant particles sedimenting between the 50S and 30S subunits, consistent with 44S assembly intermediates (Choi and Hwang, 2018). These results indicate that the D74A and N128D substitutions replicate the low-temperature ribosome assembly defect caused by bipA deletion. To achieve a definitive comparison of the ribosomal association of wild-type and mutant BipA proteins, we introduced a C-terminal FLAG-tag at the chromosomal bipA locus in the wild-type, bipAD74A, and bipAN128D strains. The expression of the FLAG-tagged BipA proteins was confirmed using western blotting analysis with an anti-FLAG antibody (Fig. S1D). Importantly, the FLAG-tagged bipAD74A-F and bipAN128D-F strains retained the cold-sensitive growth phenotypes observed in the corresponding untagged mutants (Fig. S1E–S1G). Moreover, polysome and ribosomal subunit profiling demonstrated that the ribosome profiles of the FLAG-tagged strains (bipA-F, bipAD74A-F, and bipAN128D-F) were identical to their untagged counterparts (Fig. S1H and S1I). We then examined whether the D74A and N128D substitutions altered the ribosome-binding behavior of BipA. The FLAG-tagged strains grown at 37°C or 18°C were lysed in the presence or absence of GMPPNP, subjected to sucrose gradient sedimentation, and analyzed using western blotting with an anti-FLAG antibody. In the presence of GMPPNP, wild-type BipA-F cosedimented with ribosomal fractions spanning the 70S ribosome, and the 50S and 30S subunits, with slightly stronger association at 18°C, consistent with a temperature-dependent role of BipA in ribosome function (Fig. 1G). In contrast, BipAD74A-F and BipAN128D-F were detected only in the soluble fractions at both temperatures (Fig. 1G), indicating that both mutations abolished detectable stable ribosome association, even in the presence of GMPPNP. The D74A substitution was designed based on the corresponding D270A mutation in MnmE, which has substantial GTP-binding affinity but severely impaired GTP hydrolysis (Yim et al., 2003). Nevertheless, BipAD74A resulted in a ribosome-association phenotype indistinguishable from that of the nucleotide-recognition mutant BipAN128D. Together, these findings suggest that proper function of the BipA GTPase cycle is important for productive ribosome association and the physiological function of BipA.
Altered envelope-associated phenotypes of the bipAD74A and bipAN128D mutants
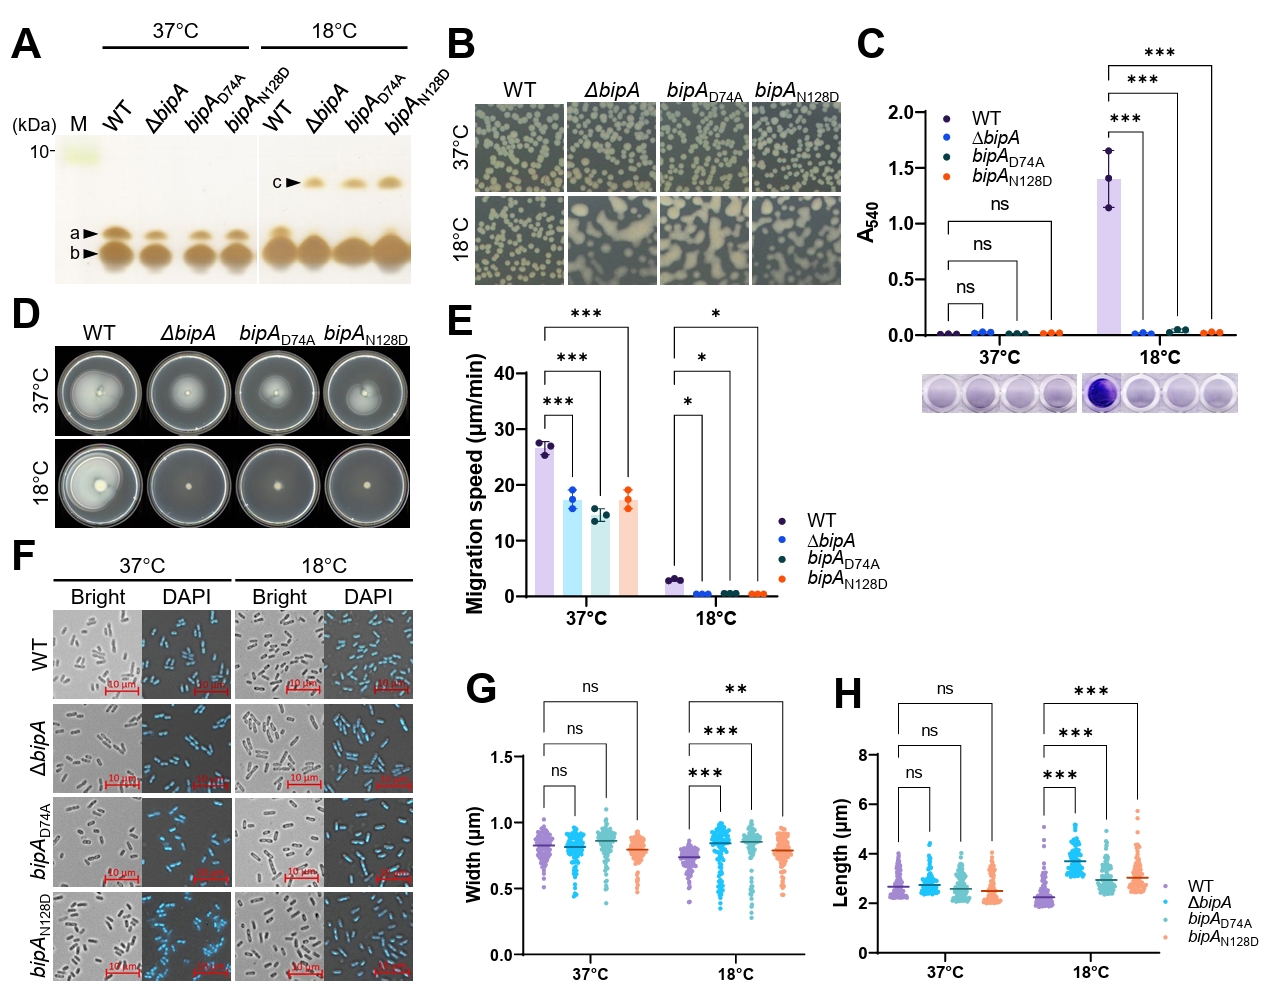
Previous studies showed that the deletion of bipA alters the lipooligosaccharides (LOS)/core region of LPS at low temperatures and induces the appearance of an abnormal core-modified species, which was proposed to represent M-LPS carrying M-antigen (colanic acid) units (Choi et al., 2025). However, whether these envelope-associated defects are linked to the GTPase activity of BipA remains unclear. To answer this question, we extracted LPS from wild-type, ΔbipA, bipAD74A, and bipAN128D strains grown at 37°C or 18°C and analyzed it using tricine-SDS–PAGE followed by silver staining. All strains grown at 37°C exhibited two LOS/core bands: band “a,” corresponding to the minor upper LOS/core species, and band “b,” corresponding to the major lower LOS/core species (Fig. 2A). In strains grown at 18°C, the wild-type strain retained this pattern; however, the ΔbipA, bipAD74A, and bipAN128D strains lacked band “a” and instead displayed an additional upper band, designated band “c.” Consistent with previous reports, band “c” most likely represents an M-LPS species carrying a single M-antigen unit. These results indicate that the GTPase-defective BipA mutants BipAD74A and BipAN128D recapitulate the low-temperature-dependent LOS/core-region alteration caused by bipA deletion. Because such LOS/core alterations are indicative of defects in the cell envelope or LPS homeostasis that may activate the Rcs signaling pathway, we then examined whether the BipA mutants also exhibited other envelope-associated phenotypes, including capsule-associated colony morphology, biofilm formation, and swimming motility. First, we examined colony morphology as a capsule-associated phenotype. For all strains grown at 37°C, the colony morphology was similar (Fig. 2B). In contrast, for strains grown at 18°C, the ΔbipA, bipAD74A, and bipAN128D strains exhibited mucoid colony morphology, whereas the wild-type strain did not. Thus, both GTPase-defective BipA mutants produce the low-temperature-dependent mucoid colony phenotype observed in the ΔbipA strain.
We also included the Δlon strain as a reference for capsule-associated phenotypes, because the loss of the Lon protein is known to increase colanic acid production (Trisler and Gottesman, 1984). As expected, the Δlon strain showed a strong mucoid phenotype, supporting its use as a reference for capsule-associated changes (Fig. S2B).
We then assessed biofilm formation using crystal violet staining. At 37°C, no strains formed a substantial biofilm (Fig. 2C). In contrast, at 18°C, biofilm formation was markedly higher in the wild-type strain than in the other strains: the ΔbipA, bipAD74A, and bipAN128D strains exhibited little or no biofilm formation. Finally, we evaluated swimming motility to determine whether BipA mutations also affected envelope-associated behavior. To assess swimming motility, the migration distance over time was measured on 0.3% agar plates. At 37°C, the swimming motility of the ΔbipA, bipAD74A, and bipAN128D strains was lower than that of the wild-type strain (Fig. 2D and 2E). This difference was larger at 18°C, as the mutant strains displayed markedly reduced migration. Thus, the D74A and N128D substitutions result in a similar phenotype to the swimming motility defect caused by bipA deletion, particularly under low-temperature conditions. In addition to defects in LPS homeostasis, the disruption of peptidoglycan homeostasis can compromise cell-envelope integrity and activate envelope stress responses, including the Rcs signaling pathway. Because peptidoglycans are central to maintaining bacterial cell shape, we used fluorescence microscopy and DAPI staining to examine whether the BipA GTPase-domain mutants affected cell morphology. Representative images of cells grown at 18°C showed that the cell morphology of the ΔbipA, bipAD74A, and bipAN128D strains differed from that of the wild-type strain (Fig. 2F). Quantitative analysis of cell width and length demonstrated that these parameters were comparable among all strains grown at 37°C (Fig. 2G and 2H). In wild-type cells, there was a modest reduction in cell width and length in cells grown at 18°C relative to 37°C, whereas cell width and length were significantly increased in the ΔbipA, bipAD74A, and bipAN128D strains at 18°C compared with the wild-type strain (Fig. 2G and 2H). These findings indicate that both bipA deletion and GTPase-defective BipA mutations result in low-temperature-dependent defects in cell morphology. Notably, FLAG-tagged BipA mutant strains also exhibited envelope-associated phenotypes, confirming that the FLAG tag did not affect these phenotypes (Fig. S2).
Together, these results indicate that the disruption of BipA GTPase-domain function reproduces multiple envelope- and morphology-associated phenotypes that occur following bipA deletion, including LOS/core-region alteration, mucoid colony morphology, reduced biofilm formation, impaired motility, and abnormal cell morphology. Our findings suggest that the GTPase function of BipA contributes to cell-envelope homeostasis and the maintenance of normal cell size, potentially through pathways linked to LOS/core integrity, peptidoglycan homeostasis, and Rcs envelope stress signaling.
High BipA expression impairs bacterial growth
Given the cellular defects observed in the deletion and GTPase-defective mutants, we further investigated whether BipA abundance also affects cellular physiology by examining phenotypic changes under conditions of BipA overexpression. Interestingly, bipA is initiated by a GTG start codon rather than the canonical ATG start codon. In E. coli, GTG acts as an initiation codon; however, it has a different initiation efficiency from ATG and is influenced by the surrounding sequence context (Hecht et al., 2017; Stenström et al., 2001). In addition, sequences immediately downstream of the start codon can influence translation initiation and protein expression, partially through effects on local mRNA structure (Kudla et al., 2009). Therefore, we examined how alterations to the native GTG start codon and N-terminal coding context impact the expression of the BipA protein.
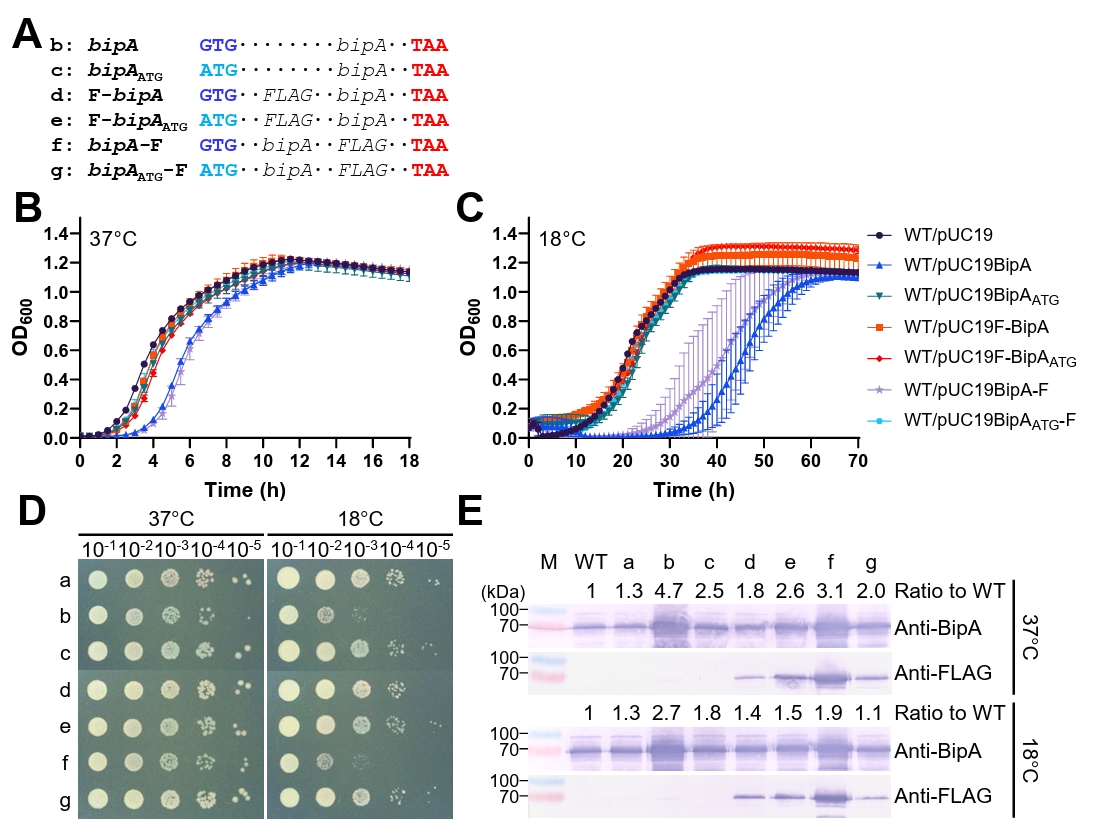
We generated a series of bipA expression constructs in which the native GTG start codon was either retained or replaced with ATG, with a FLAG-tag fused to either the N-terminus or the C-terminus (Fig. 3A). Using these constructs, we compared how the start codon, N-terminal coding context, and tag position affected BipA protein accumulation and bacterial growth.
First, we examined the constructs using the low-copy-number plasmid pACYC184 in the ΔbipA background. No transformants expressing the BipA variants exhibited growth defects at either temperature, as shown by the growth curve and spotting assays (Fig. S3A–S3C). Western blotting showed that native BipA and C-terminally FLAG-tagged BipA accumulated at the highest levels among the tested constructs and N-terminally FLAG-tagged BipA variants were expressed at lower levels than native BipA variants. Similarly, anti-FLAG blotting revealed weak F-BipAATG and BipAATG-F signals, although the F-BipA signal was not readily detectable (Fig. S3D). Coomassie brilliant blue (CBB)-staining of SDS–PAGE gels loaded with equal amounts of protein samples confirmed that the total protein loading was similar. Distinct bands corresponding to BipA and BipA-F were not observed at 37°C but were detected in the respective samples at 18°C (Fig. S3E), suggesting cold-induced gene expression.
As the expression of the BipA variants from pACYC184 did not impair bacterial growth, the high-copy-number plasmid pUC19 was then used to assess the physiological consequences of increased BipA expression, with the empty pUC19 vector serving as the plasmid control. We examined the growth of MG1655 cells carrying each pUC19-based construct at 37°C and 18°C. At 37°C, growth of cells harboring pUC19BipA or pUC19BipA-F was lower than that of cells harboring the empty-vector control, whereas transformants carrying the other constructs displayed similar growth patterns to the control (Fig. 3B). This growth defect was more pronounced at 18°C in cells carrying pUC19BipA or pUC19BipA-F; conversely, the growth of cells harboring the ATG-converted or N-terminally FLAG-tagged constructs was similar to that of the empty-vector control (Fig. 3C). Consistent with these results, spotting assays revealed the impaired growth of the pUC19BipA and pUC19BipA-F strains under low-temperature conditions (Fig. 3D).
Western blotting analysis of the pUC19-based strains revealed a similar expression pattern to that observed with pACYC184: native BipA and BipA-F resulted in the highest accumulation and F-BipAATG displayed an intermediate level, which was confirmed using densitometric analysis (Fig. 3E). CBB-staining of SDS–PAGE gels of the same samples confirmed that the total protein loading was comparable and revealed the distinct overexpression of BipA and BipA-F in the corresponding pUC19 samples at both temperatures (Fig. S3F).
Although the expression patterns were similar in the pACYC184- and pUC19-based systems, growth inhibition was observed only in cells carrying the highly expressed pUC19BipA and pUC19BipA-F constructs. Alteration of the native GTG start codon to ATG did not consistently increase BipA accumulation, and its effect varied depending on the position of the FLAG tag. However, within the N-terminally FLAG-tagged constructs, the replacement of GTG with ATG slightly increased BipA accumulation. These findings indicate that start-codon identity and N-terminal sequence context influence the steady-state accumulation of BipA and that the excessive accumulation of BipA impairs bacterial growth, particularly at low temperatures.
BipA overexpression induces cell elongation
The deletion of bipA resulted in cell enlargement, which was characterized by increased cell width and length (Fig. 2F, 2G, and 2H). This phenotype led us to examine whether changes in BipA abundance affect cell morphology and cell-length control. Therefore, we analyzed the morphology of wild-type cells expressing different levels of BipA.
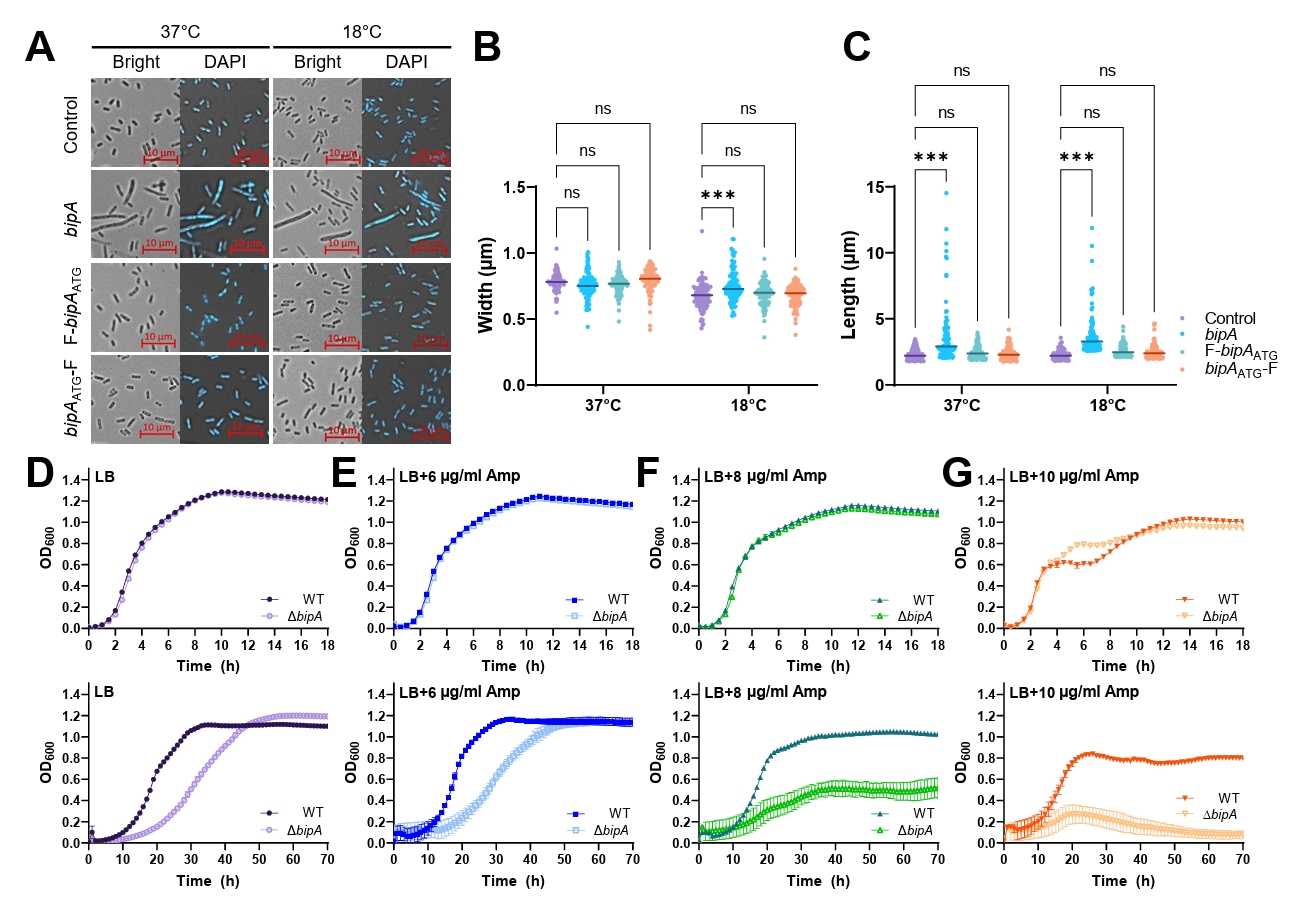
Based on the expression profiles described above, we selected three pUC19-based constructs—pUC19BipA, pUC19F-BipAATG, and pUC19BipAATG-F—as representative high-, intermediate-, and low-expression variants, respectively, introduced the constructs into MG1655, and analyzed the cell morphology. The cells were harvested when the OD600 of the culture solution was approximately 0.5 and examined using microscopy. As shown in Fig. 4A, of the three constructs tested, only cells carrying pUC19BipA (the high-expression variant, with a growth defect) displayed a markedly elongated morphology compared with the empty-vector control. This phenotype was observed at 37°C and 18°C, indicating that high BipA expression affected cell morphology under both optimal- and low-temperature conditions.
The quantitative analysis of cell width revealed no substantial differences among the constructs at 37°C. At 18°C, native BipA expression slightly increased cell width, whereas the remaining constructs resulted in cell widths similar to that of the empty-vector control (Fig. 4B). In contrast, cell length was only significantly increased in cells expressing native BipA at both temperatures. The cell length of cells expressing F-BipAATG or BipAATG-F was similar to that of the empty-vector control (Fig. 4C). Thus, the morphological effect of BipA overexpression was manifested predominantly as an increase in cell length and was associated with high expression of native BipA. Moreover, the extent of elongation induced by high BipA expression was substantially greater than the cell enlargement observed in ΔbipA cells, suggesting that excessive BipA accumulation has a marked effect on cell-length control.
We further modulated BipA expression using an IPTG-inducible construct in which the bipA coding sequence remained unchanged. Increasing IPTG concentrations progressively increased BipA accumulation and resulted in dose-dependent growth inhibition and cell elongation at both 37°C and 18°C (Fig. S4), further supporting the conclusion that excessive BipA abundance itself adversely affects bacterial growth and cell morphology.
Because both the deficiency and overexpression of BipA altered cell morphology, and because the ΔbipA strain exhibited multiple envelope-associated phenotypes, we hypothesized that BipA might be functionally associated with peptidoglycan homeostasis. The disruption of peptidoglycan synthesis alters bacterial cell shape and division (Spratt, 1975), and the impairment of septal peptidoglycan synthesis inhibits cell division, resulting in cell elongation or filamentation in E. coli (Fenton and Gerdes, 2013). We therefore compared the growth of wild-type and ΔbipA strains in the presence of increasing concentrations of ampicillin, a β-lactam antibiotic with inhibitory activity on penicillin-binding proteins that are involved in peptidoglycan synthesis.
At 37°C, increases in the ampicillin concentration increasingly reduced the growth of both strains. However, the overall responses of the wild-type and ΔbipA strains were similar; there was no clear difference in ampicillin susceptibility within the tested concentration range (upper panels in Fig. 4D–4G).
However, at 18°C, the ΔbipA strain exhibited greater sensitivity to ampicillin than the wild-type strain. Increases in ampicillin concentrations increasingly inhibited the growth of both strains, with a more pronounced difference at higher ampicillin concentrations. The wild-type strain retained substantial growth at 10 μg/ml ampicillin, whereas the growth of the ΔbipA strain was markedly impaired at 8 μg/ml and was almost undetectable at 10 μg/ml (lower panels in Fig. 4D–4G). These findings indicate that deletion of bipA increases susceptibility to ampicillin under low-temperature conditions, consistent with the temperature-dependent morphological and envelope-associated defects observed in the ΔbipA strain.
The increased cell size resulting from bipA deletion, the pronounced cell elongation caused by BipA overexpression, and the increased susceptibility of the ΔbipA strain to ampicillin at low temperatures suggest a possible association between BipA and peptidoglycan-related processes, in addition to its role in cell-envelope homeostasis.
Discussion
In this work, chromosomal bipAD74A and bipAN128D mutants were studied to determine the physiological importance of the conserved GTPase motifs of BipA under native expression conditions. The two substitution mutants reproduced the low-temperature ribosome assembly and cell envelope-associated defects observed in the ΔbipA strain (Figs. 1 and 2), demonstrating that the presence of BipA alone is insufficient and that intact GTPase functionality is essential for its physiological function. However, BipA overexpression impaired growth and altered cell morphology (Figs. 3 and 4), indicating that both the activity and cellular abundance of BipA must be tightly regulated.
The selected substitutions were designed to disrupt distinct steps of the BipA GTPase cycle. N128D targets the G4 motif responsible for guanine nucleotide recognition, and the reduced GTPase activity and abolished ribosome association are consistent with impaired nucleotide binding (Fig. 1). In contrast, D74A, located in the G3 (switch II) motif, was predominantly expected to impair Mg2+-dependent GTP hydrolysis. Indeed, an analogous G3 motif substitution in another bacterial GTPase markedly reduced hydrolysis without completely abolishing nucleotide binding (Yim et al., 2003). However, very low levels of BipAD74A were detected in ribosomal fractions, even in the presence of GMPPNP (Fig. 1G). Previous biochemical and structural studies have shown that ribosome binding and the GTPase activity of BipA are tightly coupled, and that its switch regions become ordered upon ribosome association, with switch II becoming positioned adjacent to the sarcin–ricin loop of the 50S subunit (deLivron et al., 2009; Kumar et al., 2015). The D74A substitution may therefore reduce nucleotide occupancy (or exchange) or disrupt the switch II conformational rearrangement that is required for stable ribosome association, in addition to impairing GTP hydrolysis. Collectively, these findings suggest that substitutions in the conserved GTPase motifs of BipA can produce phenotypes similar to those of the ΔbipA mutant, highlighting the importance of proper GTPase cycling for the physiological function of BipA.
These GTPase mutants also replicated the altered LOS/core profiles, increased mucoid character, and reduced motility and biofilm formation observed in the ΔbipA strain at low temperatures (Fig. 2), indicating that an intact BipA GTPase cycle is also required for cell-envelope homeostasis. The Rcs phosphorelay is a plausible mediator of these phenotypes, as it responds to outer membrane damage (including damage to LPS), and regulates capsule production, motility, and biofilm formation (Wall et al., 2018). BipA was originally identified in Salmonella Typhimurium as a protein strongly induced by exposure to bactericidal/permeability-increasing (BPI) protein, which binds the lipid A moiety of LPS and damages the Gram-negative bacterial envelope (Qi et al., 1995). This implies that BipA participates in LPS remodeling under envelope stress conditions.
However, perturbations in peptidoglycan homeostasis also activate the Rcs signaling pathway (Laubacher and Ades, 2008). As shown in Figs. 3 and 4, the overexpression of BipA from the high-copy-number plasmid pUC19 inhibited cell growth and caused marked cell elongation at both 37°C and 18°C. In contrast, expression from the low-copy-number plasmid pACYC184 restored the growth of the ΔbipA strain without detectable toxicity (Figs. 3 and S3). Interestingly, the overexpression of BipA resulted in more severe cell elongation than that observed in the ΔbipA, bipAD74A, or bipAN128D strains, despite the pronounced low-temperature growth defects of these mutants (Figs. 2 and 3). The overexpression systems used in this study may produce BipA levels above the physiological range. Nevertheless, the consistent growth inhibition and cell elongation observed with increasing BipA expression support the conclusion that excessive BipA accumulation itself is detrimental to cellular physiology.
Previous studies have shown that impaired coordination between cell elongation and division disrupts septal peptidoglycan synthesis, leading to elongated cells (Fenton and Gerdes, 2013). In the present study, high BipA expression resulted in pronounced cell elongation at 37°C and 18°C, although ampicillin resulted in greater growth inhibition in the ΔbipA strain than the wild-type strain at 18°C (Fig. 4). Because β-lactam antibiotics inhibit peptidoglycan synthesis and alter cell morphology (Garde et al., 2021), and peptidoglycan stress can activate the Rcs phosphorelay and contribute to intrinsic β-lactam resistance (Laubacher and Ades, 2008), the increased susceptibility of the ΔbipA strain to ampicillin suggests that the loss of BipA may affect peptidoglycan-related processes involved in cell-envelope homeostasis. Peptidoglycan remodeling during cold adaptation may also contribute to the stronger phenotype observed at low temperature (Nallamotu et al., 2023). Together, these findings suggest that an appropriate abundance of BipA is required for normal cell-shape maintenance and that BipA contributes to LPS homeostasis and may also affect peptidoglycan-related processes, particularly at low temperatures. However, further direct analyses of peptidoglycan composition and turnover are needed to determine whether the observed cell elongation and increased ampicillin sensitivity are associated with altered peptidoglycan synthesis or remodeling.
Previously, we showed that bipA transcription is upregulated not only by low temperatures but also by CRP (Choi and Hwang, 2018). In the present study, constructs carrying the native GTG start codon led to higher expression of BipA than the corresponding ATG constructs, whereas insertion of an ATG-FLAG sequence at the 5′-end of bipA resulted in a modest reduction in BipA expression compared with the bipAATG construct (Fig. 3E). These results indicate that BipA production is determined not only by the start codon but also by the immediate downstream nucleotide sequence, which influences translation efficiency. It remains to be determined whether local mRNA secondary structure and ribosome accessibility to the Shine-Dalgarno sequence also contribute to the regulation of BipA expression (Bhattacharyya et al., 2018; Goodman et al., 2013). Collectively, these findings suggest that BipA expression is regulated at multiple levels, including both transcription and translation, to precisely control its cellular abundance.
These findings suggest that BipA induction may be part of a broader adaptive response in which BipA-dependent ribosome function supports cell-envelope reorganization under stress. In this context, impaired ribosome function in BipA-deficient cells could compromise cell envelope adaptation, potentially including peptidoglycan synthesis, thereby promoting Rcs-associated changes in capsule production, motility, biofilm formation, and cell morphology. This model provides a possible connection between the ribosome assembly defects, altered LOS/core profiles, ampicillin responses, and envelope-associated phenotypes observed in this study. Further analyses of peptidoglycan remodeling, Rcs activity, and BPI susceptibility will be needed to evaluate this hypothesis.
Acknowledgments
This work was supported by a Two-Year Research Grant of Pusan National University.
Conflict of Interest
The authors declare that the research was conducted in the absence of any commercial or financial relationships that could be construed as a potential conflict of interest.
Supplementary Information
The online version contains supplementary material available at https://doi.org/10.71150/jm.2608017
Fig. S1.
Complementation and functional characterization of chromosomal bipA mutant strains. (A and B) Growth curves of chromosomal bipA GTPase-defective mutant strains transformed with either the empty vector pACYC184 or pACYC184BipA were measured at 37°C (A) and 18°C (B). The same symbols are used in both panels. The data presented are the Mean ± SD of three independent experiments. (C) The indicated strains carrying pACYC184 or pACYC184BipA were serially diluted, spotted onto LB agar plates supplemented with chloramphenicol, and incubated at the indicated temperatures. Labels a–g correspond to the following strain/plasmid combinations: (a) WT/pACYC184, (b) ΔbipA/pACYC184, (c) ΔbipA/pACYC184BipA, (d) bipAD74A/pACYC184, (e) bipAD74A/pACYC184BipA, (f) bipAN128D/pACYC184, and (g) bipAN128D/pACYC184BipA. (D) Western blotting analysis was performed to confirm the expression of BipA and FLAG-tagged BipA in the WT strain and chromosomal bipA GTPase-defective mutant strains generated using the CRISPR/Cas9 system. Whole-cell samples were analyzed using SDS–PAGE followed by immunoblotting with anti-BipA or anti-FLAG antibodies. M, molecular weight marker. (E and F) Growth curves of strains expressing chromosomally encoded BipA-F, BipAD74A-F, or BipAN128D-F were measured at 37°C (E) and 18°C (F). The data are presented as the Mean ± SD of three independent experiments. The same symbols are used in both panels. (G) Overnight cultures were serially diluted (10⁻¹–10⁻⁵), spotted onto LB agar plates, and incubated at the indicated temperatures. (H and I) Polysome (H) and ribosomal subunit (I) profiles of the indicated strains were analyzed using sucrose gradient sedimentation, as described in the Materials and Methods. Black, red, and blue vertical lines indicate the positions of the 70S ribosome, 50S subunit, and 30S subunit, respectively. Red arrowheads indicate abnormal 44S ribosomal particles.
jm-2608017-Supplementary-Fig-S1.pdf
Fig. S2.
Cell surface-associated phenotypes of chromosomal FLAG-tagged bipA mutant strains. Chromosomal FLAG-tagged BipA strains were analyzed under the indicated temperature conditions as described in the Materials and Methods. (A) Lipid A-core oligosaccharide profiles were analyzed using tricine-SDS–PAGE followed by silver staining. The Δlon strain was included as a control for M-LPS analysis. Arrowheads indicate the lipid A-core oligosaccharide bands, designated a–c. M, molecular weight marker. (B) Capsule-associated colony morphology was examined on LB agar plates after incubation at 37°C or 18°C. The Δlon strain was included as a control for the capsule-associated phenotype. (C) Biofilm formation was quantified using crystal violet staining. Representative crystal violet-stained wells are shown below the graph. (D and E) Swimming motility was assessed at 37°C and 18°C on soft LB agar plates (D), and migration speed was calculated by dividing the migration distance by the incubation time (E). For Panels C and E, the data presented are the Mean ± SD of three independent experiments, with individual data points shown as circles. Statistical significance was determined using ordinary two-way analysis of variance (ANOVA) followed by Dunnett’s multiple comparison test, with the BipA-F strain used as the control for each temperature; ns, not significant; **p < 0.01; ***p < 0.001.
jm-2608017-Supplementary-Fig-S2.pdf
Fig. S3.
Effects of BipA complementation and overexpression on cell growth. (A and B) ΔbipA strains carrying pACYC184-based BipA variants were diluted 1:200 into fresh LB medium supplemented with chloramphenicol and grown at 37°C (A) and 18°C (B). The data presented are the mean ± SD of three independent experiments. The same symbols are used in both panels. (C) Overnight cultures were serially diluted (10⁻¹–10⁻⁵), spotted onto LB agar plates supplemented with chloramphenicol, and incubated at the indicated temperatures. (a) pACYC184 (empty vector); (b–g) ΔbipA strains carrying the pACYC-based BipA constructs shown in Fig. 3A. (D) Cells grown at the indicated temperatures were harvested, resuspended in 1× SDS sample buffer, and analyzed using western blotting with anti-BipA or anti-FLAG antibodies. Labels a–g are as defined in Panel C. Relative BipA protein expression was quantified from the anti-BipA immunoblots using ImageJ after background subtraction and normalization to the wild-type sample on the same blot, which was assigned a value of 1.0. (E and F) Boiled samples prepared for western blotting analysis were subjected to SDS–PAGE followed by Coomassie blue staining. Samples were prepared from ΔbipA complementation strains carrying pACYC184-based BipA variants (E) and MG1655 overexpression strains carrying pUC19-based BipA variants (F). Cells were grown at 37°C or 18°C before sample preparation. Black arrowheads indicate BipA. M, molecular weight marker.
jm-2608017-Supplementary-Fig-S3.pdf
Fig. S4.
Dose-dependent effects of BipA on bacterial growth and cell morphology. (A and B) Growth curves of E. coli MG1655 carrying the empty pIN-A vector or pINBipA at the indicated IPTG concentrations at 37°C (A) and 18°C (B). (C) Spotting assays of the same strains on LB agar containing the indicated IPTG concentrations at 37°C and 18°C. (D) Western blot analysis of BipA expression at the indicated IPTG concentrations. Protein samples from the pIN-A and pINBipA transformants were diluted 40-fold before SDS-PAGE and immunoblotting. Relative BipA protein levels were quantified from anti-BipA immunoblots using ImageJ and normalized to the empty pIN-A vector control at the corresponding temperature, which was assigned a value of 1.0. (E) Representative bright-field and DAPI-stained images of cells grown at 37°C and 18°C at the indicated IPTG concentrations. Scale bars = 10 μm. (F) Quantitative analysis of cell width and length under the same conditions. A total of 100 cells were analyzed for each condition. Statistical significance is indicated as ns, not significant; **p < 0.01; *** p < 0.001.
jm-2608017-Supplementary-Fig-S4.pdf
Fig. 1.Cold-sensitive phenotypes of the bipA mutant strains. (A and B) Growth curves of the wild-type, ΔbipA, and chromosomal bipA GTPase-defective strains generated using the CRISPR/Cas9 system were measured at 37°C (A) and 18°C (B). The data presented are the Mean ± SD of three independent experiments. (C) Overnight cultures were serially diluted from 10−1 to 10−5, spotted onto LB agar plates, and incubated at the indicated temperatures. (D) GTPase activities of wild-type BipA and the BipA mutant proteins were determined by measuring the release of free inorganic phosphate using the Malachite Green Phosphate Assay Kit, as described in Materials and Methods. The data presented are the mean ± SD of three independent experiments; individual dots represent independent experiments. Statistical significance was determined using ordinary one-way analysis of variance (ANOVA) followed by Dunnett’s multiple comparisons test, with wild-type BipA as the control; ***p < 0.001. (E and F) Polysome (E) and ribosomal subunit (F) profiles of the indicated strains were analyzed using sucrose gradient sedimentation. Black, red, and blue vertical lines indicate the positions of the 70S ribosome, 50S subunit, and 30S subunit, respectively. Red arrowheads indicate abnormal 44S ribosomal particles. (G) Fractions collected after sucrose gradient sedimentation in the absence or presence of guanosine 5′-(β,γ-imido)triphosphate (GMPPNP) were analyzed using western blotting with an anti-FLAG antibody to examine the ribosome association of BipA-F, BipAD74A-F, and BipAN128D-F. Black arrowheads indicate FLAG-tagged BipA proteins. FLAG− and FLAG+ indicate whole-cell samples prepared from strains without (−) and with (+) the chromosomal FLAG tag. M, molecular weight marker.
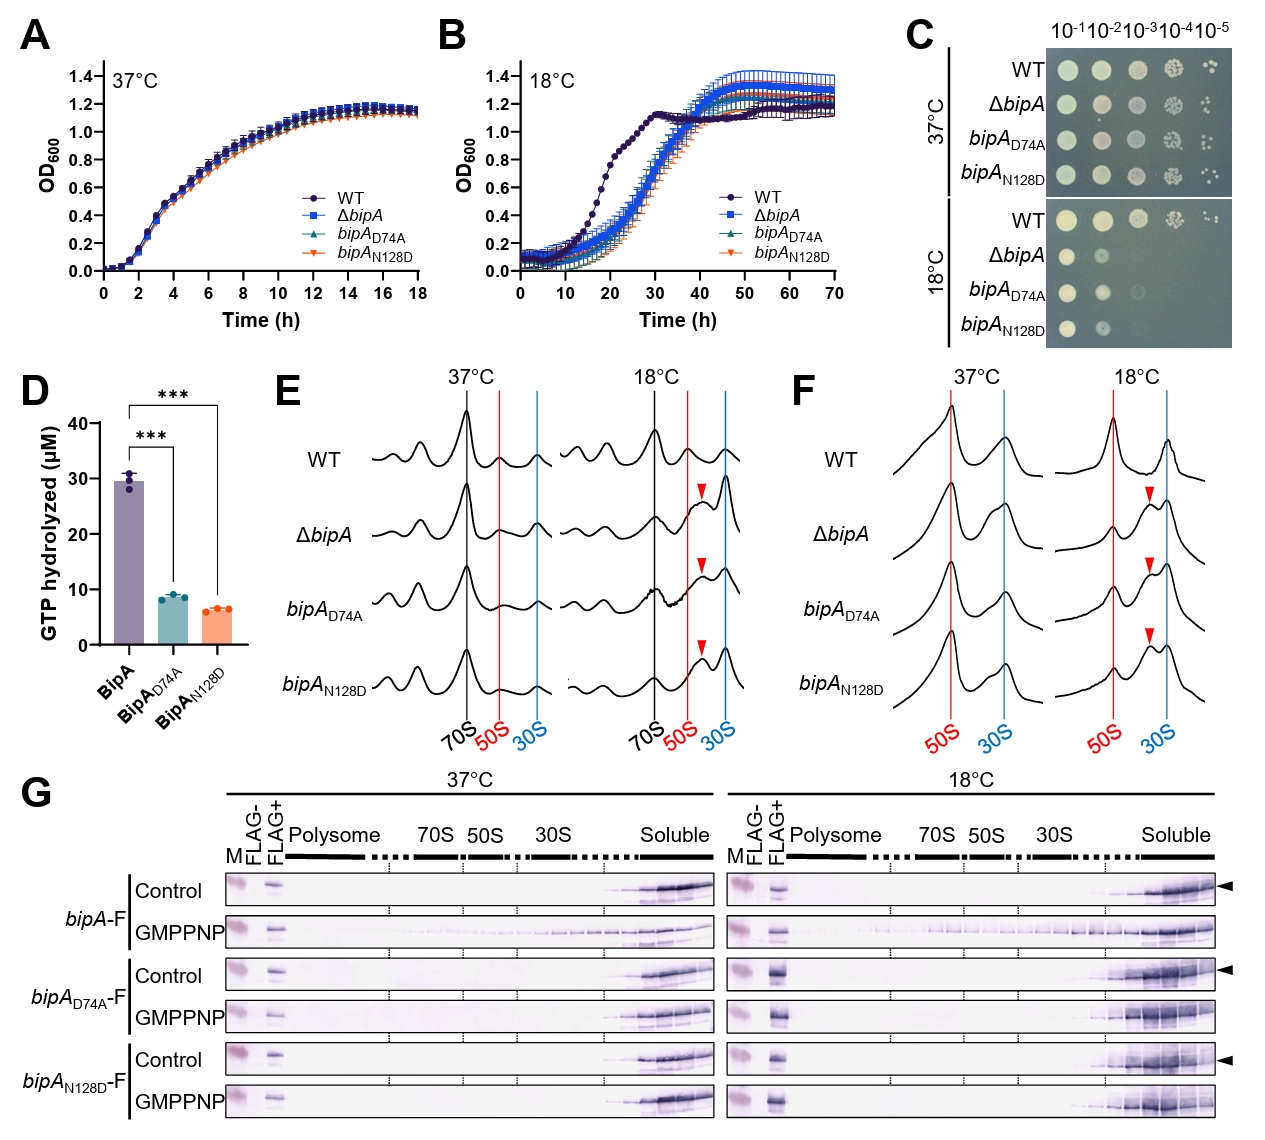
Fig. 2.Cell surface-associated phenotypes and cell morphology of bipA mutant strains. (A) Lipid A-core oligosaccharide profiles were analyzed using tricine-SDS–PAGE followed by silver staining. M, molecular weight marker. (B) Capsule-associated colony morphology was examined on LB agar plates. Overnight cultures were diluted to an OD600 of 0.2 in fresh LB medium, further diluted to 10⁻⁴, spread onto LB agar plates, and incubated at 37°C for 16 h or at 18°C for 6 days before imaging. (C) Biofilm formation was quantified using crystal violet staining. Representative images of crystal violet-stained wells are shown below the graph. (D) Swimming motility at 37°C and 18°C was assessed on soft LB agar plates. (E) Migration speed was calculated by dividing the migration distance by the incubation time. For Panels C and E, the data presented are the mean ± SD of three independent experiments, with individual data points shown as circles. (F) Representative bright-field and 4′,6-diamidino-2-phenylindole (DAPI) fluorescence microscopy images of the indicated strains grown at 37°C or 18°C. Cells are stained with DAPI to visualize nucleoids. Scale bar = 10 μm. (G and H) Cell width (G) and cell length (H) were quantified from microscopy images using ImageJ and MicrobeJ. Cell dimensions were measured for 100 cells per strain per condition from a representative experiment. Each dot represents an individual cell; bars show the mean ± SD. The same symbols are used in both panels. Statistical significance in Panels C, E, G, and H was determined using ordinary two-way ANOVA followed by Dunnett’s multiple comparisons test, with the wild-type strain as the control at each temperature; ns, not significant; *p < 0.05; **p < 0.01; ***p < 0.001.
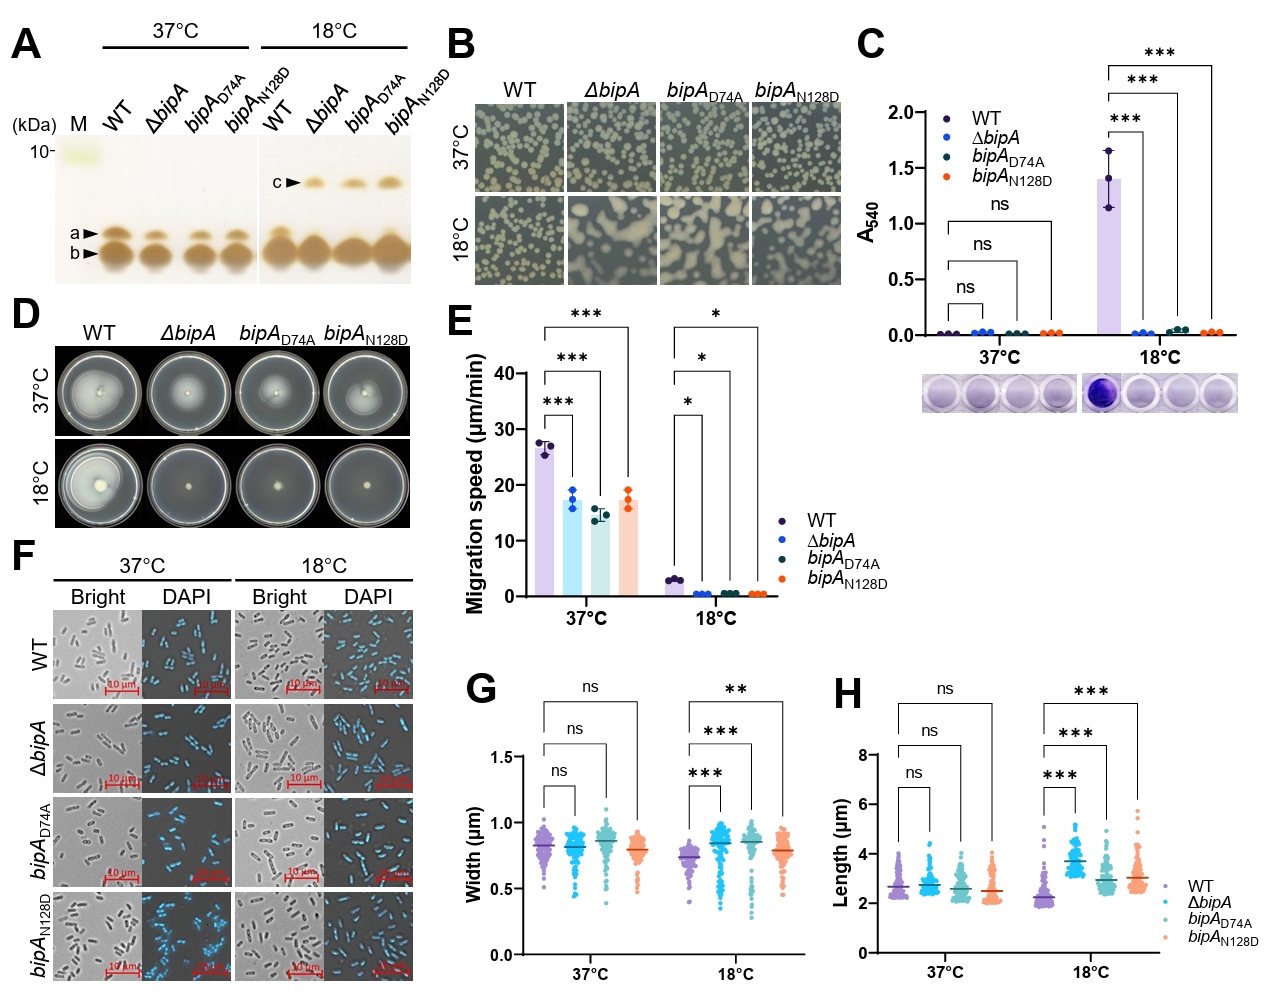
Fig. 3.Growth inhibition associated with high BipA expression. (A) Schematic representation of the native bipA gene, ATG point mutation, and FLAG insertion mutation. (B and C) MG1655 strains carrying pUC19-based BipA variants were diluted 1:200 into fresh LB medium supplemented with ampicillin and then grown at 37°C (B) or 18°C (C). The data presented are the mean ± SD of three independent experiments. The same symbols are used in both panels. (D) Overnight cultures were serially diluted (10⁻¹–10⁻⁵), spotted onto LB agar plates supplemented with ampicillin, and incubated at the indicated temperatures. (a) pUC19 (empty vector); (b–g) MG1655 strains carrying the BipA constructs shown in (A). (E) Cells grown at the indicated temperatures were harvested, resuspended in 1× SDS sample buffer, and analyzed using western blotting with anti-BipA or anti-FLAG antibodies. Labels a–g are as defined in Panel D. Anti-BipA band intensities were quantified using densitometric analysis and ImageJ, with background subtraction applied. Values above the bands represent relative BipA levels, normalized to the untransformed wild-type MG1655 sample, which was assigned a value of 1.0. M, molecular weight marker.
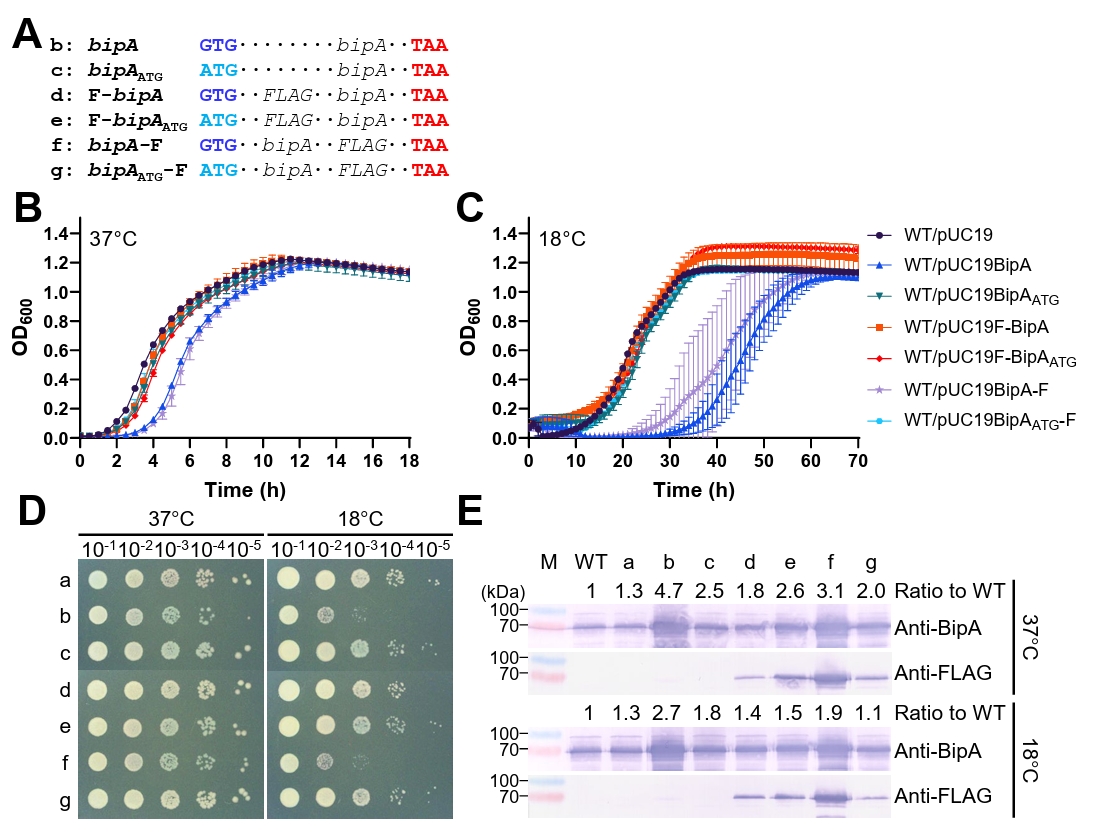
Fig. 4.BipA-dependent changes in cell morphology and ampicillin susceptibility. (A) Representative bright-field and DAPI fluorescence microscopy images of MG1655 strains carrying the indicated pUC19-based BipA constructs. Control, MG1655 carrying the empty pUC19 vector. Cells were stained with DAPI to visualize nucleoids. Scale bar = 10 μm. (B and C) Cell width (B) and cell length (C) were quantified from microscopy images using ImageJ and MicrobeJ. Cell dimensions were measured for 100 cells per strain per condition in a representative experiment. Each dot represents an individual cell; bars show the mean ± SD. Statistical significance was determined using ordinary two-way ANOVA followed by Dunnett’s multiple comparison test, with the empty-vector strain at each temperature used as the control. ns, not significant; ***p < 0.001. The same symbols are used in both panels. (D–G) Wild-type and ΔbipA strains were diluted 1:200 into fresh LB medium containing the indicated concentrations of ampicillin and grown at 37°C (upper panels in D–G) and 18°C (lower panels in D–G). The data presented are the mean ± SD of three independent experiments. The same symbols are used in both panels.
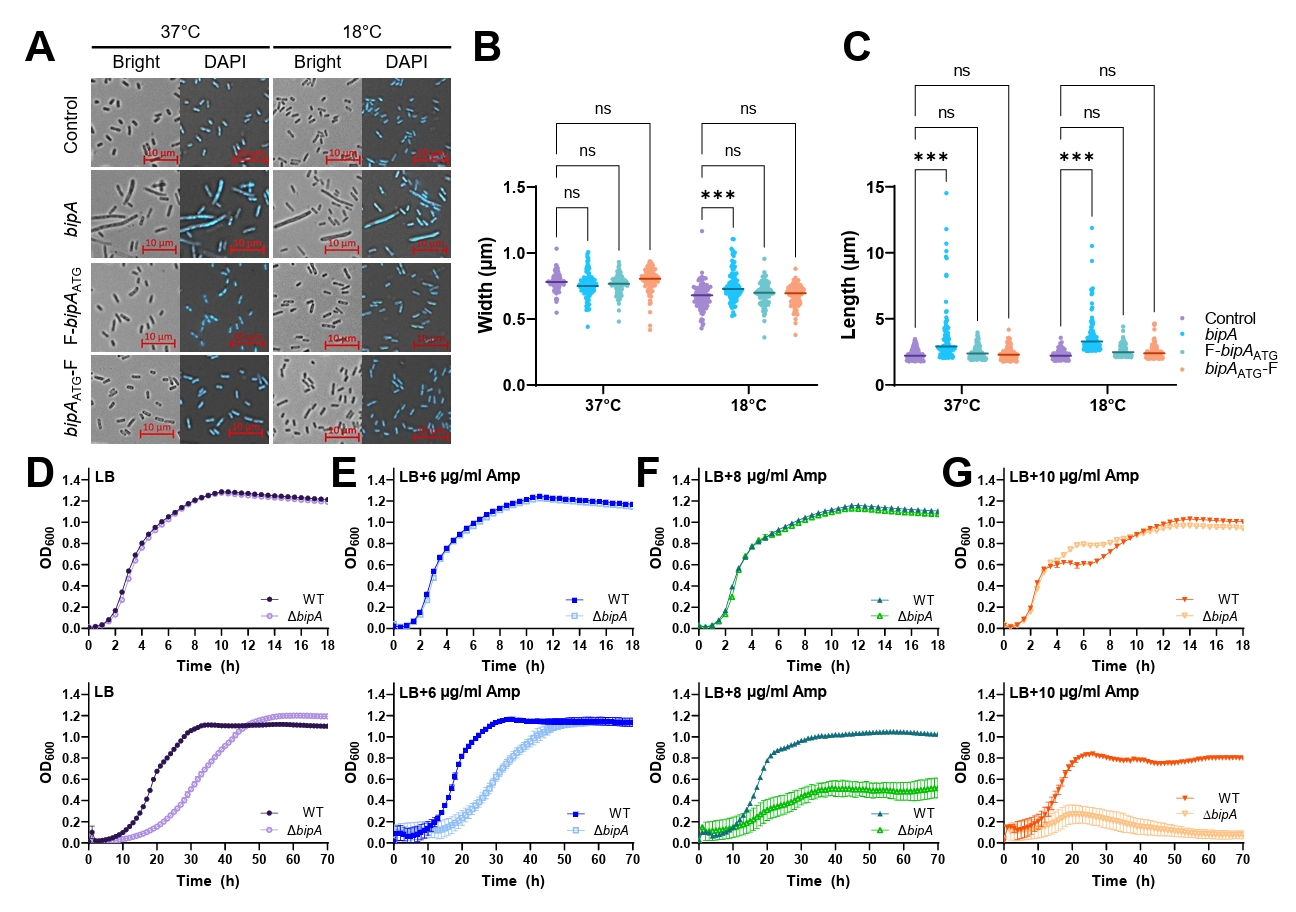
Table 1.Strains and plasmids used in this study
|
Strain |
Genotype |
Reference |
|
MG1655 |
F− λ− ilvG- rfb-50 rph-1, E. coli K-12 |
Blattner et al. (1997)
|
|
MG1655ΔbipA
|
bipA::kan, MG1655 |
Choi and Hwang (2018)
|
|
MG1655Δlon
|
lon::kan, MG1655 |
Choi et al. (2025)
|
|
MG1655bipA-F |
bipA-FLAG, MG1655 |
This study |
|
MG1655bipAN128D
|
bipAN128D, MG1655 |
This study |
|
MG1655bipAN128D-F |
bipAN128D-FLAG, MG1655 |
This study |
|
MG1655bipAD74A
|
bipAD74A, MG1655 |
This study |
|
MG1655bipAD74A-F |
bipAD74A-FLAG, MG1655 |
This study |
|
BL21(DE3) |
F− ompT hsdSB (rB− mB−) gal dcm (DE3), E. coli
|
Novagen |
|
Plasmid
|
|
|
|
pACYC184 |
ori p15A, CmR, TetR
|
New England Biolabs |
|
pACYC184BipA |
bipA+, pACYC184 |
Choi and Hwang (2018)
|
|
pACYC184BipAATG
|
ATG initiation codon, pACYC184BipA |
This study |
|
pACYC184F-BipA |
5′ FLAG tag sequence insertion, pACYC184BipA |
This study |
|
pACYC184F-BipAATG
|
ATG initiation codon, pACYC184F-BipA |
This study |
|
pACYC184BipA-F |
3′ FLAG tag sequence insertion, pACYC184BipA |
This study |
|
pACYC184BipAATG-F |
ATG initiation codon, pACYC184BipA-F |
This study |
|
pUC19 |
ori ColE1 and AmpR
|
New England Biolabs |
|
pUC19BipA |
bipA+, pUC19 |
This study |
|
pUC19BipAATG
|
The same insert as in pACYC184BipAATG, pUC19 |
This study |
|
pUC19F-BipA |
The same insert as in pACYC184F-BipA, pUC19 |
This study |
|
pUC19F-BipAATG
|
The same insert as in pACYC184F-BipAATG, pUC19 |
This study |
|
pUC19BipA-F |
The same insert as in pACYC184BipA-F, pUC19 |
This study |
|
pUC19BipAATG-F |
The same insert as in pACYC184BipAATG-F, pUC19 |
This study |
|
pET28a |
His6-tagged expression vector, KanR
|
Novagen |
|
pET28BipA |
bipA+, pET28a |
Choi and Hwang (2018)
|
|
pET28BipAD74A
|
bipAD74A, pET28a |
This study |
|
pET28BipAN128D
|
bipAN128D, pET28a |
Choi and Hwang (2018)
|
|
pIN-A |
lppp, lacpo, AmpR, expression vector |
Ghrayeb et al. (1984)
|
|
pINBipA |
bipA+, pIN-A |
This study |
|
pKDsgRNA-BipA |
sgRNA targeting the 3′ end of bipA, pKDsgRNA |
This study |
|
pKDsgRNA-BipAD74A
|
sgRNA targeting Asp 74 of bipA, pKDsgRNA |
This study |
|
pKDsgRNA-BipAN128D
|
sgRNA targeting Asn 128 of bipA, pKDsgRNA |
This study |
|
pKDsgRNA-p15a |
sgRNA targeting pCas9cr4 and pKDsgRNA (Plasmid #62656) |
Addgene |
|
pCas9cr4 |
Inducible Cas9 λ-Red vector (Plasmid #62655) |
Addgene |
Table 2.Primers used in this study
|
Primer |
Sequences (5′→3′) |
|
bipA-100bp-up |
CTCTGCAATACTTGTTTG |
|
bipA-100bp-down |
CCACAGACTTATAAGGGAG |
|
bipA-5-NdeI |
GGCATATGATCGAAAAATTGCGTAA |
|
bipA-3-BamHI |
AGGGATCCTTAATCGTCTTTCGGTG |
|
BipA-D74A-F |
GTATCAACATCGTTGCGACCCCGGGGCACGCC |
|
BipA-D74A-R |
GGCGTGCCCCGGGGTCGCAACGATGTTGATACGG |
|
BipA-FLAG-F |
TAATTTCGTTTTTTAGTCATAAAAAACCTGCCAGC |
|
BipA-FLAG-R |
CTTATCGTCGTCATCCTTGTAATCATCGTCTTTCGGTGCGCGGTTG |
|
FLAG-BipA-F |
GATTACAAGGATGACGACGATAAGATCGAAAAATTGCGTAATATCGCCA |
|
FLAG-BipA-R |
CACAACTTTGCCTCAGGCATTA |
|
M-FLAG-BipA-F |
ATGGATTACAAGGATGACGACGATAAGATCGAAAAATTGCGTAATATCGCCA |
|
M-FLAG-BipA-R |
AACTTTGCCTCAGGCATTAGAA |
|
BipA sgRNA 3′ Flag |
AAACGAAATTAATCGTCTTTGTTTTAGAGCTAGAAATAGCAAG |
|
BipA 3′-Flag donor |
CGCTGGCAGGTTTTTTATGACTAAAAAACGAAATTACTTATCGTCGTCATCCTTGTAATCATCGTCTTTCGGTGCGCGGTTGGCGCGGCGACGATC |
|
BipAD74A sgRNA BOTTOM |
GGGTATCAACGATGTTGATAGTTTTAGAGCTAGAAATAGCAAG |
|
BipAD74A Donor DNA |
CATTACACGTTCAACTTCACCACCGAAGTCGGCGTGCCCCGGAGTGGCCACAATGTTGATACGGTAATCATTCCATTTGATAGCGGTGTTTTT |
|
BipAN128D sgRNA TOP |
ATCAACAAAGTTGACCGCCCGTTTTAGAGCTAGAAATAGCAAG |
|
BipAN128D Donor DNA |
CTGATCCACAACCCAATCAGGACGCGCGCCAGGGCGGTCTACCTTATCAATAACAACAATCGGCTTCAGGCCGTAAGCAAACGCTTTTTTGGT |
|
PtetR |
GTGCTCAGTATCTCTATCACTGA |
References
- Bhattacharyya S, Jacobs WM, Adkar BV, Yan J, Zhang W, et al. 2018. Accessibility of the Shine-Dalgarno sequence dictates N-terminal codon bias in E. coli. Mol Cell. 70: 894–905.e5. ArticlePubMedPMC
- Blattner FR, Plunkett G 3rd, Bloch CA, Perna NT, Burland V, et al. 1997. The complete genome sequence of Escherichia coli K-12. Science. 277: 1453–1462. ArticlePubMed
- Choi E, Huh A, Hwang J. 2023. Novel rRNA transcriptional activity of NhaR revealed by its growth recovery for the bipA-deleted Escherichia coli at low temperature. Front Mol Biosci. 10: 1175889.ArticlePubMedPMC
- Choi E, Hwang J. 2018. The GTPase BipA expressed at low temperature in Escherichia coli assists ribosome assembly and has chaperone-like activity. J Biol Chem. 293: 18404–18419. ArticlePubMedPMC
- Choi E, Jeon H, Oh C, Hwang J. 2020a. Elucidation of a novel role of YebC in surface polysaccharides regulation of Escherichia coli bipA-deletion. Front Microbiol. 11: 597515.Article
- Choi E, Jeon H, Oh JI, Hwang J. 2020b. Overexpressed L20 rescues 50S ribosomal subunit assembly defects of bipA-deletion in Escherichia coli. Front Microbiol. 10: 2982.Article
- Choi E, Ryu E, Kim D, Byun JW, Kim K, et al. 2025. The dual functions of the GTPase BipA in ribosome assembly and surface structure biogenesis in Salmonella enterica serovar Typhimurium. PLoS Pathog. 21: e1013047. ArticlePubMedPMC
- Crane SD, Banerjee SK, Eichelberger KR, Kurten RC, Goldman WE, et al. 2021. The Yersinia pestis GTPase BipA promotes pathogenesis of primary pneumonic plague. Infect Immun. 89: e00673-20.ArticlePubMedPMCLink
- deLivron MA, Makanji HS, Lane MC, Robinson VL. 2009. A novel domain in translational GTPase BipA mediates interaction with the 70S ribosome and influences GTP hydrolysis. Biochemistry. 48: 10533–10541. ArticlePubMed
- Fenton AK, Gerdes K. 2013. Direct interaction of FtsZ and MreB is required for septum synthesis and cell division in Escherichia coli. EMBO J. 32: 1953–1965. ArticlePubMedPMCPDF
- Garde S, Chodisetti PK, Reddy M. 2021. Peptidoglycan: Structure, synthesis, and regulation. EcoSal Plus. 9: eESP-0010-2020.ArticlePubMedPMCLink
- Ghrayeb J, Kimura H, Takahara M, Hsiung H, Masui Y, et al. 1984. Secretion cloning vectors in Escherichia coli. EMBO J. 3: 2437–2442. ArticlePubMedPMCPDF
- Goodman DB, Church GM, Kosuri S. 2013. Causes and effects of N-terminal codon bias in bacterial genes. Science. 342: 475–479. ArticlePubMed
- Hecht A, Glasgow J, Jaschke PR, Bawazer LA, Munson MS, et al. 2017. Measurements of translation initiation from all 64 codons in E. coli. Nucleic Acids Res. 45: 3615–3626. ArticlePubMedPMC
- Kudla G, Murray AW, Tollervey D, Plotkin JB. 2009. Coding-sequence determinants of gene expression in Escherichia coli. Science. 324: 255–258. ArticlePubMedPMC
- Kumar V, Chen Y, Ero R, Ahmed T, Tan J, et al. 2015. Structure of BipA in GTP form bound to the ratcheted ribosome. Proc Natl Acad Sci USA. 112: 10944–10949. ArticlePubMedPMC
- Laubacher ME, Ades SE. 2008. The Rcs phosphorelay is a cell envelope stress response activated by peptidoglycan stress and contributes to intrinsic antibiotic resistance. J Bacteriol. 190: 2065–2074. ArticlePubMedPMCLink
- Nallamotu KC, Bahadur R, Kaul M, Reddy M. 2023. Peptidoglycan remodeling by an L,D-transpeptidase, LdtD during cold shock in Escherichia coli. J Bacteriol. 205: e00382-22.ArticlePubMedLink
- Qi SY, Li Y, Szyroki A, Giles IG, Moir A, et al. 1995. Salmonella typhimurium responses to a bactericidal protein from human neutrophils. Mol Microbiol. 17: 523–531. ArticlePubMed
- Reisch CR, Prather KL. 2015. The no-SCAR (scarless Cas9 assisted recombineering) system for genome editing in Escherichia coli. Sci Rep. 5: 15096.ArticlePubMedPMCPDF
- Spratt BG. 1975. Distinct penicillin binding proteins involved in the division, elongation, and shape of Escherichia coli K12. Proc Natl Acad Sci USA. 72: 2999–3003. ArticlePubMedPMC
- Stenström CM, Holmgren E, Isaksson LA. 2001. Cooperative effects by the initiation codon and its flanking regions on translation initiation. Gene. 273: 259–265. ArticlePubMed
- Trisler P, Gottesman S. 1984. lon transcriptional regulation of genes necessary for capsular polysaccharide synthesis in Escherichia coli K-12. J Bacteriol. 160: 184–191. ArticlePubMedPMCLink
- Wall E, Majdalani N, Gottesman S. 2018. The complex Rcs regulatory cascade. Annu Rev Microbiol. 72: 111–139. ArticlePubMed
- Yim L, Martínez-Vicente M, Villarroya M, Aguado C, Knecht E, et al. 2003. The GTPase activity and C-terminal cysteine of the Escherichia coli MnmE protein are essential for its tRNA modifying function. J Biol Chem. 278: 28378–28387. ArticlePubMed
Citations
Citations to this article as recorded by

 MSK




 ePub Link
 Cite this Article
 XML Download