- About
- Browse Articles
-
Special Issues
- Pioneering strategies for overcoming bacterial drug resistance (2026)
- Advancing microbial engineering through synthetic biology (2025)
- Host-associated microbiome (2024)
- Bacterial regulatory mechanisms for the control of complex cellular mechanisms (2023)
- Two years into COVID-19 pandemic: Where are we? (2022)
- Collections
- For Contributors
- Policies
- E-Submission

- About
- Browse Articles
-
Special Issues
- Pioneering strategies for overcoming bacterial drug resistance (2026)
- Advancing microbial engineering through synthetic biology (2025)
- Host-associated microbiome (2024)
- Bacterial regulatory mechanisms for the control of complex cellular mechanisms (2023)
- Two years into COVID-19 pandemic: Where are we? (2022)
- Collections
- Policies
- For Contributors
Articles
- Page Path
- HOME > J. Microbiol > Volume 63(11); 2025 > Article
-
Full article
Safety evaluation and hypolipidemic ability of water-soluble blue pigment extracted by HPD-400 resin from Quambalaria cyanescens - Ruobing Shi†, Chengzhong Wang†, Nianping Xue, Zhiguo Zhang*
-
Journal of Microbiology 2025;63(11):e2412011.
DOI: https://doi.org/10.71150/jm.2412011
Published online: November 30, 2025
School of Food Science and Engineering, Qilu University of Technology (Shandong Academy of Sciences), Jinan 250353, P. R. China
- *Correspondence Zhiguo Zhang zzg@qlu.edu.cn
- †These authors contributed equally to this work.
© The Author(s), under exclusive licence to Microbiological Society of Korea 2026
This is an Open Access article distributed under the terms of the Creative Commons Attribution 4.0 International License (CC BY 4.0) (https://creativecommons.org/licenses/by/4.0/) which permits unrestricted use, distribution, and reproduction in any medium, provided the original work is properly cited.
- 1,697 Views
- 33 Download
ABSTRACT
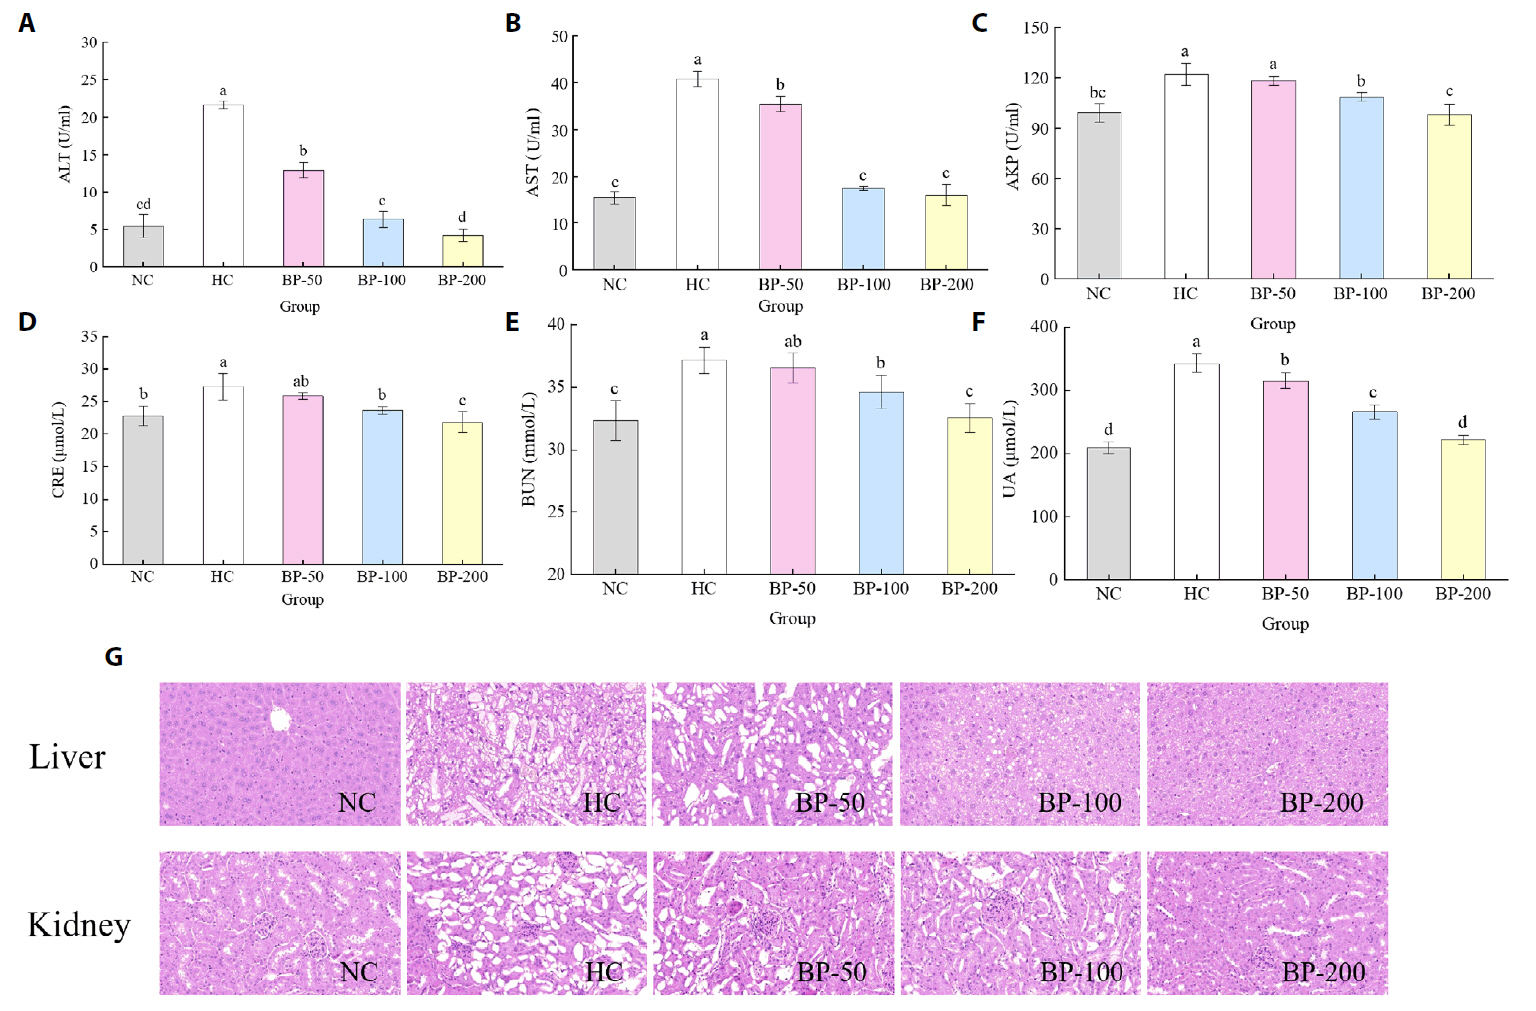
- The oral administration of synthetic drugs can effectively reduce blood lipid levels, but adverse reactions may occur. Because of this, the hypolipidemic ability of natural products has been increasingly investigated. We evaluate the safety and hypolipidemic characteristics of a water-soluble blue pigment extracted using HPD-400 resin from the fungus Quambalaria cyanescens. Hypolipidemic ability was examined by constructing a hyperlipidemia model with different doses of blue pigment (50, 100, and 200 mg/kg. mouse body weight) for 28 d. Blue pigment purity increased from 20.32% to 70.70% following treatment with HPD-400 resin. Acute toxicity tests revealed blue pigment sourced from Q. cyanescens to have no toxic effects on mouse body weight, mortality, or behavioral characteristics. Subacute toxicity tests revealed no significant differences in food intake, body weight, or organ weights between treatment groups and controls. Histopathological examination of the liver and kidney tissues of mice administered blue pigment were normal, and serum enzyme activities and blood constituents were also within normal ranges. Blue pigment can significantly reduce the weight of mice, reduce liver and kidney damage and fat accumulation. It can also reduce total cholesterol, triglyceride and low density lipoprotein cholesterol in serum and liver tissue, and increase the level of high density lipoprotein cholesterol. Reduce the levels of alanine aminotransferase, aspartate aminotransferase, alkaline phosphatase, creatinine, urea and uric acid in serum. Increase the activities of total superoxide dismutase, glutathione peroxidase and catalase in serum and liver tissue, reduce the content of malondialdehyde, and up-regulate liver lipase and lipoprotein lipase. Our work proves that blue pigment is nontoxic, has the function of reducing blood lipid, and can alleviate obesity-related symptoms by regulating lipid metabolism and oxidative stress.
Introduction
Materials and Methods
Results and Discussion
Conclusion
Acknowledgments
This work was supported by the Natural Science Foundation of Shandong province [grant number ZR2020MC211].
Conflict of Interest
The authors declare that they have no known competing financial interests or personal relationships that could appear to have influenced research reported in this paper.


Data are expressed as Means ± SD (n = 5). No significant difference was found between groups (one-way ANOVA, P > 0.05). AKP, alkaline phosphatase; ALT, alanine aminotransferase; AST, aspartate aminotransferase; CRE, creatinine; GGT, gamma-glutamyl transferase; Hb, hemoglobin; LDH, lactate dehydrogenase; MCH, mean cell corpuscular hemoglobin concentration; MCV, mean corpuscular volume; PCV, packed cell volume; PLT, platelet; RBC, red blood cells; TC, cholesterol; WBC, white blood cells
- Amalraj S, Krupa J, Raj CD, Gurav SS, Gandhi GR, et al. 2024. Antidiabetic and antioxidant activities of the hydroalcoholic extracts of Canthium coromandelicum (Burm.f.) Alston leaf in streptozotocin-induced diabetic rats. Process Biochem. 137: 85–98. Article
- Chen S, Su DX, Gao MX, Zhang JL, Liu YB, et al. 2021. A facile macroporous resin-based method for separation of yellow and orange Monascus pigments. Food Sci Biotechnol. 30: 545–553. ArticlePubMedPMCPDF
- Cheng Z, Li N, Chen Z, Li K, Qiao D, et al. 2023. Ingesting retrograded rice (Oryza sativa) starch relieves high-fat diet induced hyperlipidemia in mice by altering intestinal bacteria. Food Chem. 426: 136540.ArticlePubMed
- Copetti MV. 2019. Fungi as industrial producers of food ingredients. Curr Opin Food Sci. 25: 52–56. Article
- Dong X, Li X, Ding L, Cui F, Tang Z, et al. 2014. Stage extraction of capsaicinoids and red pigments from fresh red pepper (Capsicum) fruits with ethanol as solvent. LWT-Food Sci Technol. 59: 396–402. Article
- Feng X, Guo M, Li J, Shen Z, Mo F, et al. 2024. The structural characterization of a novel Chinese yam polysaccharide and its hypolipidemic activity in HFD-induced obese C57BL/6J mice. Int J Biol Macromol. 265: 130521.ArticlePubMed
- Figueredo KC, Guex CG, Reginato FZ, Haas da Silva AR, Cassanego GB, et al. 2018. Safety assessment of Morus nigra L. leaves: acute and subacute oral toxicity studies in Wistar rats. J Ethnopharmacol. 224: 290–296. ArticlePubMed
- Finger S, Godoy FA, Wittwer G, Aranda CP, Calderón R, et al. 2019. Purification and characterization of indochrome type blue pigment produced by Pseudarthrobacter sp. 34LCH1 isolated from Atacama Desert. J Ind Microbiol Biotechnol. 46: 101–111. ArticlePubMedPDF
- Harman D. 1980. Free radical theory of aging: Origin of life, evolution, and aging. Age. 3: 100–102. ArticlePDF
- Hou Y, Vasileva EA, Mishchenko NP, Carne A, McConnell M, et al. 2019. Extraction, structural characterization and stability of polyhydroxylated naphthoquinones from shell and spine of New Zealand sea urchin (Evechinus chloroticus). Food Chem. 272: 379–387. ArticlePubMed
- Huang L. 2023. Master thesis. Optimization of fermentation, purification and activity of blue pigments from Quambalaria cyanescens QY229. Qilu University of Technology, Shandong, China.
- Incalza MA, D’Oria R, Natalicchio A, Perrini S, Laviola L, et al. 2018. Oxidative stress and reactive oxygen species in endothelial dysfunction associated with cardiovascular and metabolic diseases. Vascul Pharmacol. 100: 1–19. ArticlePubMed
- Jonsson M, Jestoi M, Nathanail AV, Kokkonen UM, Anttila M, et al. 2013. Application of OECD guideline 423 in assessing the acute oral toxicity of moniliformin. Food Chem Toxicol. 53: 27–32. ArticlePubMed
- Li J, Chase HA. 2010. Development of adsorptive (non-ionic) macroporous resins and their uses in the purification of pharmacologically-active natural products from plant sources. Nat Prod Rep. 27: 1493–1510. ArticlePubMed
- Lin H, Li J, Sun M, Wang X, Zhao J, et al. 2024. Effects of hazelnut soluble dietary fiber on lipid-lowering and gut microbiota in high-fat-diet-fed rats. Int J Biol Macromol. 256: 128538.ArticlePubMed
- Meshram V, Kapoor N, Dwibedi V, Srivastava A, Saxena S. 2022. Extracellular resveratrol producing endophytic fungus, Quambalaria cyanescens. S Afr J Bot. 146: 409–416. Article
- Mukinda JT, Syce JA. 2007. Acute and chronic toxicity of the aqueous extract of Artemisia afra in rodents. J Ethnopharmacol. 112: 138–144. ArticlePubMed
- Narmani A, Arzanlou M. 2019. Quambalaria cyanescens, a new fungal trunk pathogen associated with grapevine decline in Iran. Crop Prot. 124: 104875.Article
- Neuvonen P, Niemi M, Backman J. 2006. Drug interactions with lipid-lowering drugs: Mechanisms and clinical relevance. Clin Pharmacol Ther. 80: 565–581. ArticlePubMed
- Pandit SG, Puttananjaiah MH, Serva Peddha M, Dhale MA. 2020. Safety efficacy and chemical profiling of water-soluble Talaromyces purpureogenus CFRM02 pigment. Food Chem. 310: 125869.ArticlePubMed
- Phainuphong P, Rukachaisirikul V, Saithong S, Phongpaichit S, Bowornwiriyapan K, et al. 2016. Lovastatin analogues from the soil-derived fungus Aspergillus sclerotiorum PSU-RSPG178. J Nat Prod. 79: 1500–1507. ArticlePubMed
- Poorniammal R, Prabhu S, Dufossé L, Kannan J. 2021. Safety evaluation of fungal pigments for food applications. J Fungi. 7: 692.Article
- Srinivasan N, Thangavelu K, Uthandi S. 2022. Lovastatin production by an oleaginous fungus, Aspergillus terreus KPR12 using sago processing wastewater (SWW). Microb Cell Fact. 21: 22.ArticlePubMedPMCPDF
- Stodůlková E, Císařová I, Kolařík M, Chudíčková M, Novák P, et al. 2015. Biologically active metabolites produced by the basidiomycete Quambalaria cyanescens. PLoS One. 10: e0118913. ArticlePubMedPMC
- Stodůlková E, Šulc M, Císařová I, Novák P, Kolařík M, et al. 2008. Production of (+)-globulol needle crystals on the surface mycelium of Quambalaria cyanescens. Folia Microbiol. 53: 15–22. ArticlePDF
- Stroes ES, Thompson PD, Corsini A, Vladutiu GD, Raal FJ, et al. 2015. Statin-associated muscle symptoms: Impact on statin therapy—European Atherosclerosis Society Consensus Panel Statement on assessment, aetiology and management. Eur Heart J. 36: 1012–1022. ArticlePubMedPMC
- Tang S, Dong X, Ma Y, Zhou H, He Y, et al. 2024. Highly crystalline cellulose microparticles from dealginated seaweed waste ameliorate high fat-sugar diet-induced hyperlipidemia in mice by modulating gut microbiota. Int J Biol Macromol. 263: 130485.ArticlePubMed
- Tang C, Wang Y, Chen D, Zhang M, Xu J, et al. 2023. Natural polysaccharides protect against diet-induced obesity by improving lipid metabolism and regulating the immune system. Food Res Int. 172: 113192.ArticlePubMed
- Touiss I, Khatib S, Bekkouch O, Amrani S, Harnafi H. 2017. Phenolic extract from Ocimum basilicum restores lipid metabolism in Triton WR-1339-induced hyperlipidemic mice and prevents lipoprotein-rich plasma oxidation. Food Sci Hum Wellness. 6: 28–33. Article
- Upendra RS, Khandelwal P, Amiri ZR, Shwetha L, Ausim M. 2013. Screening and molecular characterization of natural fungal isolates producing lovastatin. J Microb Biochem Technol. 5: 25–30.Article
- Wang N, Tong Z, Wang D, Zhang Y, Liu T. 2022. Effects of Hericium erinaceus polypeptide on lowering blood lipids of mice with hyperlipidemia induced by a high-fat diet. J Future Foods. 2: 346–357. Article
- Wei ZF, Wang XQ, Peng X, Wang W, Zhao CJ, et al. 2015. Fast and green extraction and separation of main bioactive flavonoids from Radix Scutellariae. Ind Crops Prod. 63: 175–181. Article
- Wen C, Song D, Zhuang L, Liu G, Liang L, et al. 2022. Isolation and identification of polyphenol monomers from celery leaves and their structure-antioxidant activity relationship. Process Biochem. 121: 69–77. Article
- Yang RL, Le G, Li A, Zheng J, Shi Y. 2006. Effect of antioxidant capacity on blood lipid metabolism and lipoprotein lipase activity of rats fed a high-fat diet. Nutrition. 22: 1185–1191. ArticlePubMed
- Yang R, Meng D, Song Y, Li J, Zhang Y, et al. 2012. Simultaneous decoloration and deproteinization of crude polysaccharide from pumpkin residues by cross-linked polystyrene macroporous resin. J Agric Food Chem. 60: 8450–8456. ArticlePubMed
- Yu G, Wang S, Wang L, Che Q, Zhu T, et al. 2018. Lipid-lowering polyketides from the fungus Penicillium steckii HDN13-279. Mar Drugs. 16: 25.ArticlePubMedPMC
- Yu X, Xing X, Dong Q, Shi K, Yan R. 2022. Separation, quantification and characterisation of the pigment produced by Paecilomyces lilacinus TD16. Nat Prod Res. 36: 5053–5057. ArticlePubMed
- Zhu L, Huang L, Xie Y, Zhang T, Jiang Z, et al. 2023. Optimization of fermentation, purification, and properties of blue pigment produced from Quambalaria cyanescens QY229. J Appl Microbiol. 134: lxad143.ArticlePubMedPDF
References
Supplementary Information
References
Citations
 ePub Link
 Cite this Article
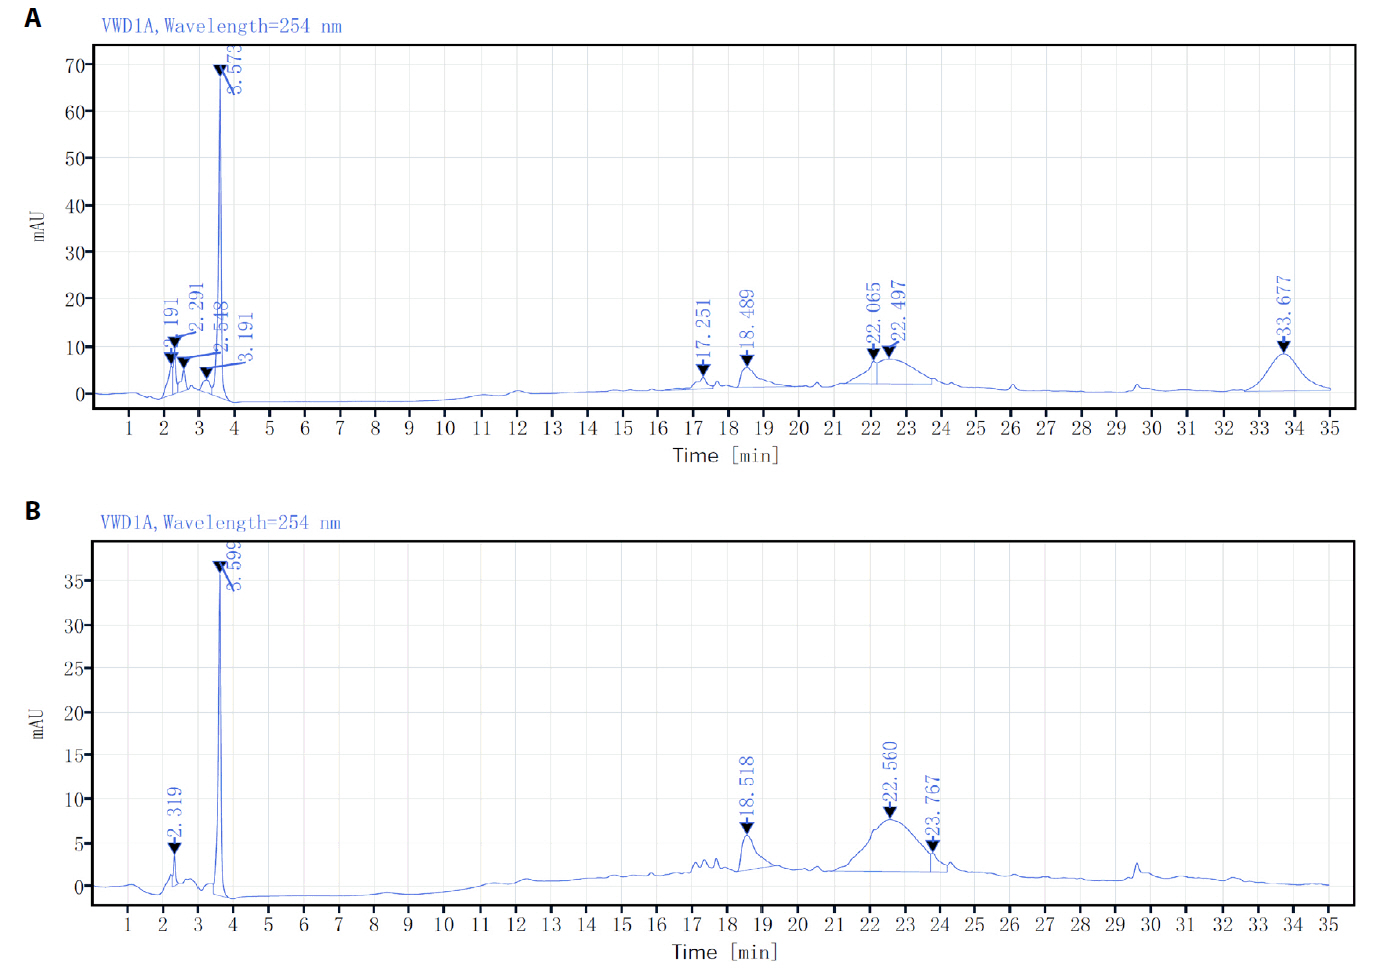

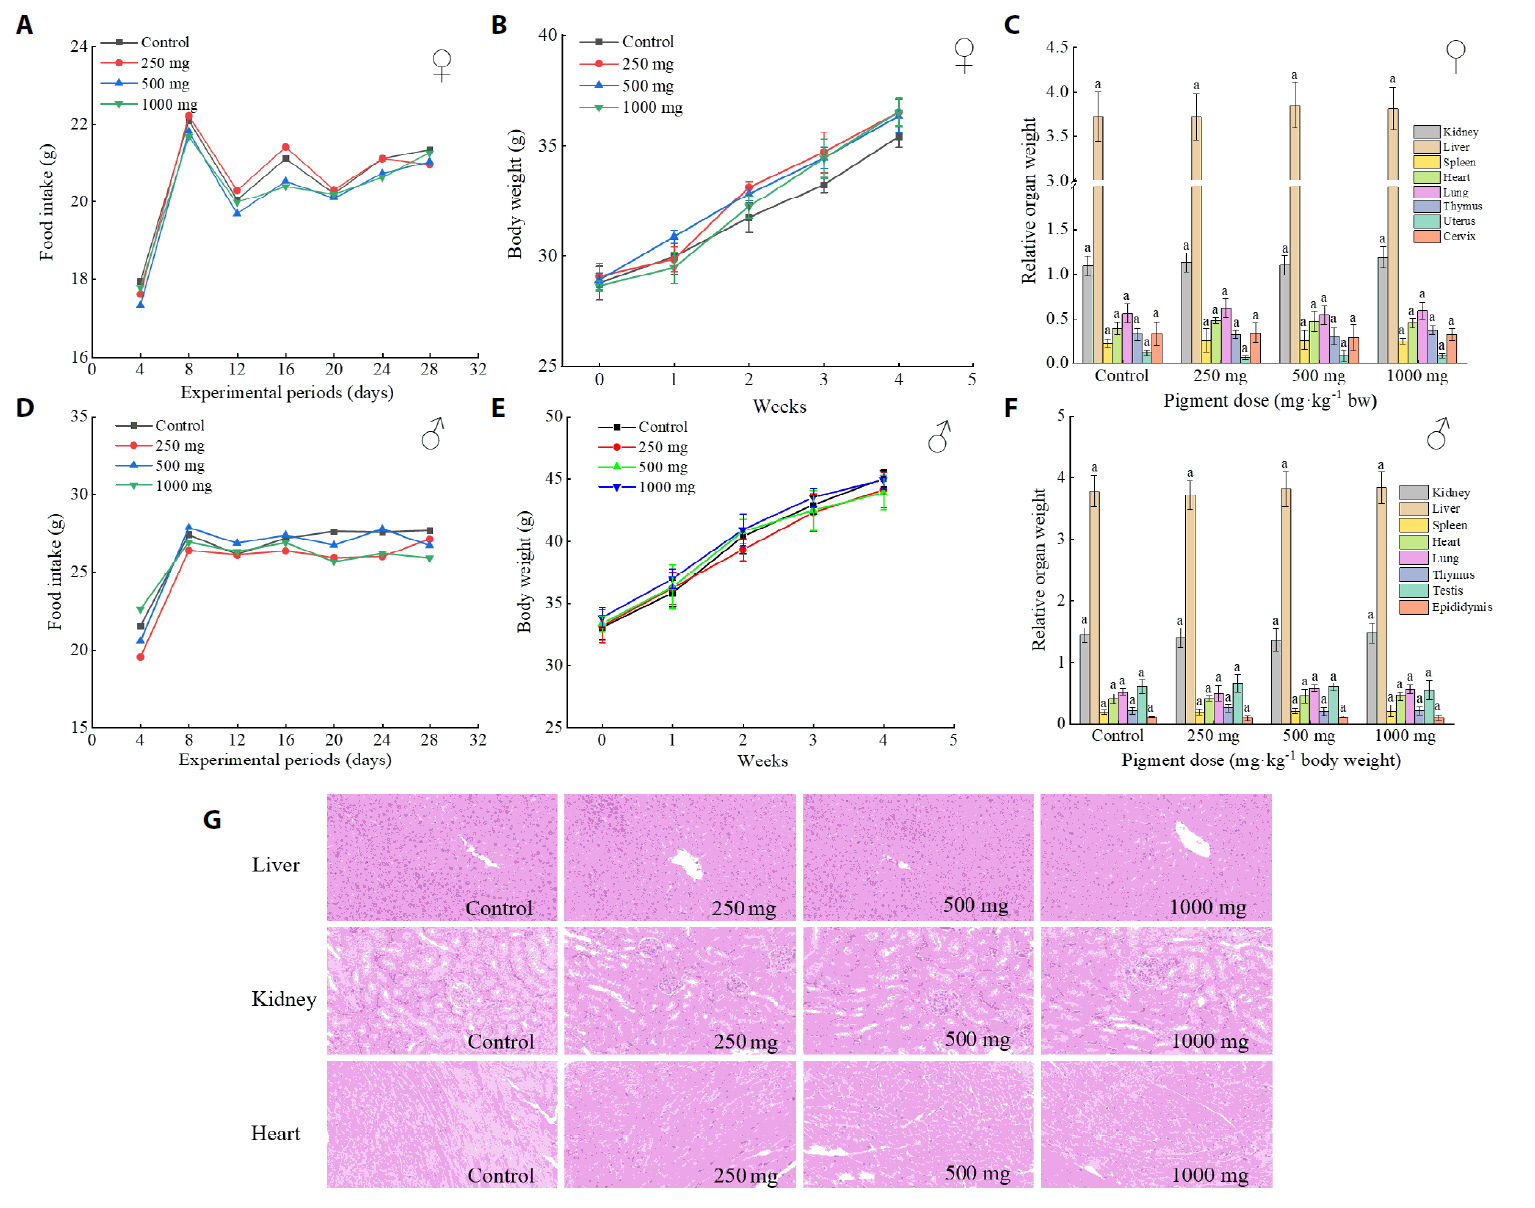
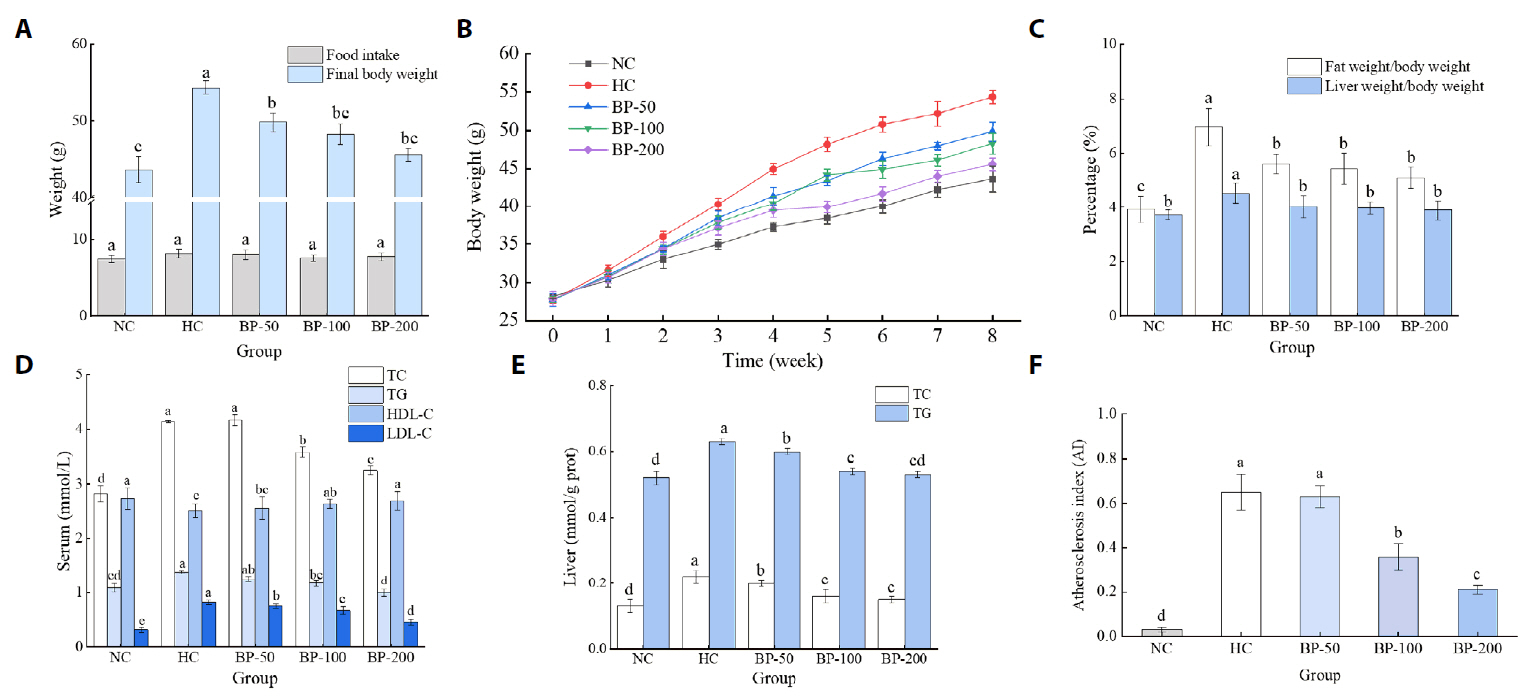
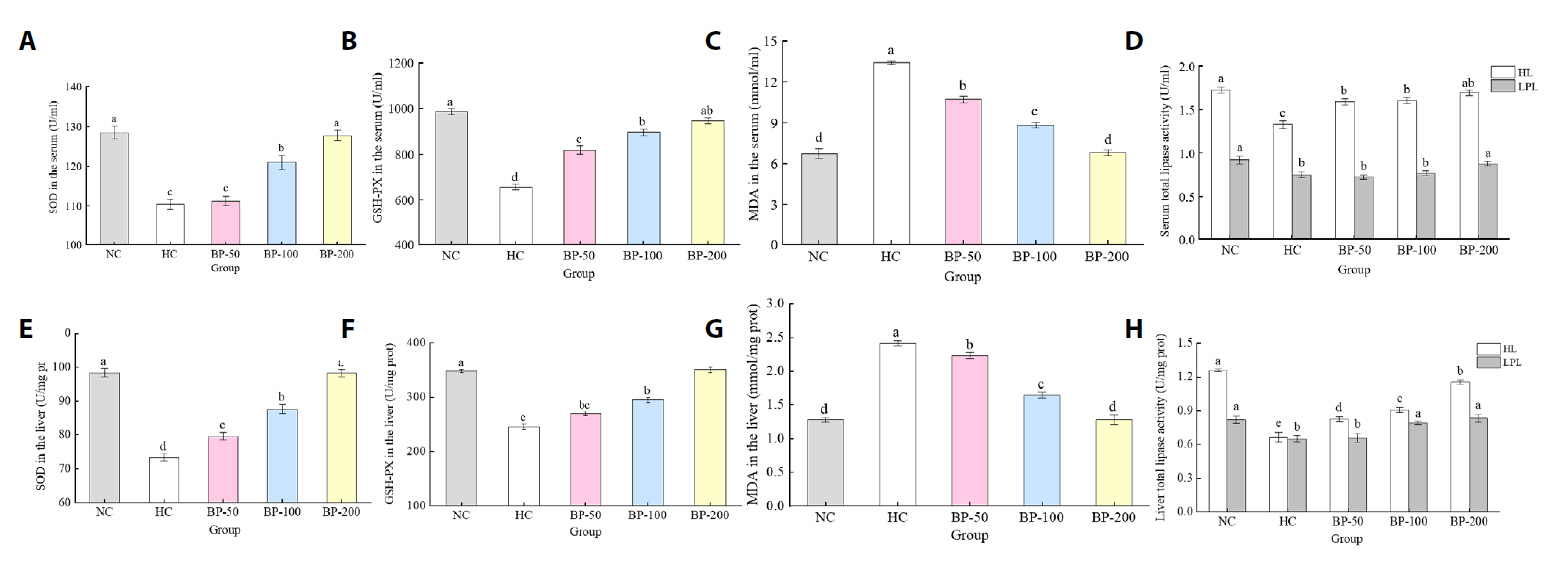


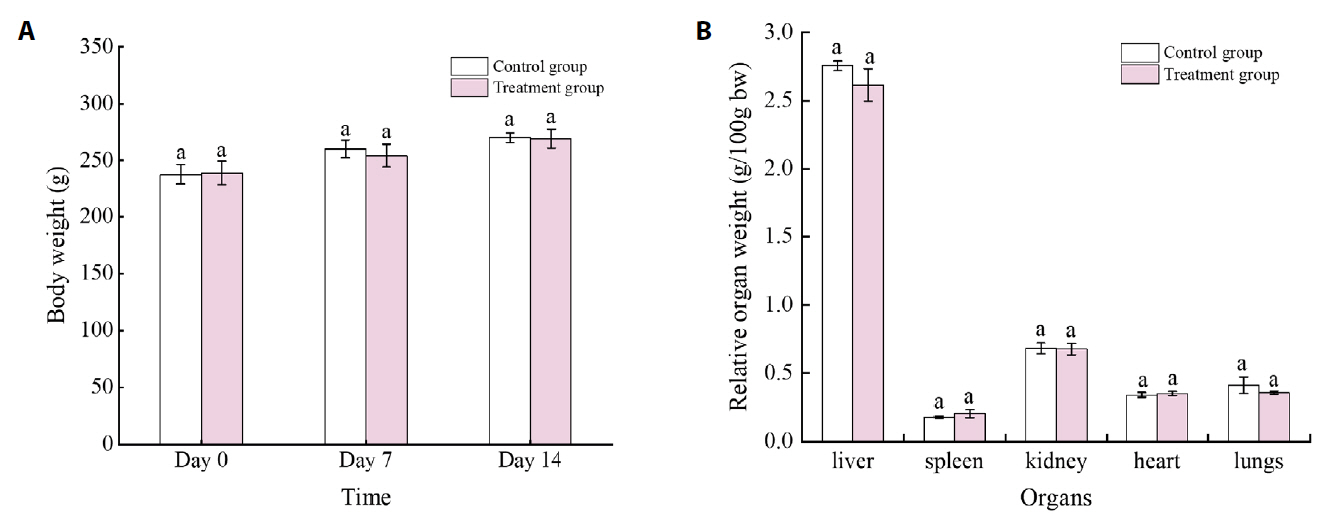


Fig. 1.
Fig. 2.
Fig. 3.
Fig. 4.
Fig. 5.
Fig. 6.
| Number | Group | Treatment |
|---|---|---|
| 1 | Blank control group (NC) | Normal diet + normal saline |
| 2 | High-fat model control group (HC) | High-fat diet + normal saline |
| 3 | Low-dose group (BP-50) | High-fat diet + 50 mg/kg/d BP |
| 4 | Medium-dose group (BP-100) | High-fat diet + 100 mg/kg/d BP |
| 5 | High-dose group (BP-200) | High-fat diet + 200 mg/kg/d BP |
| Parameters | Daily dose (28 Days) | |||||||
|---|---|---|---|---|---|---|---|---|
| Control | Group Ⅰ (250 mg/kg bw) | Group Ⅱ (500 mg/kg bw) | Group Ⅲ (500 mg/kg bw) | |||||
| Male | Female | Male | Female | Male | Female | Male | Female | |
| Hb (g/L) | 142.12 ± 12.73a | 142.45 ± 15.56a | 140.56 ± 14.85a | 142.43 ± 11.88a | 143.27 ± 18.21a | 140.53 ± 19.19a | 141.51 ± 14.95a | 141.94 ± 16.97a |
| RBC (1012/L) | 8.68 ± 1.10a | 8.63 ± 1.25a | 8.63 ± 1.52a | 8.46 ± 1.67a | 8.69 ± 1.27a | 8.40 ± 1.56a | 8.93 ± 1.67a | 8.76 ± 1.21a |
| WBC (109/L) | 3.31 ± 0.23a | 3.40 ± 0.16a | 3.67 ± 0.29a | 3.55 ± 0.46a | 3.34 ± 0.17a | 3.56 ± 0.25a | 3.32 ± 0.29a | 3.47 ± 0.23a |
| PCV (%) | 49.85 ± 2.19a | 49.65 ± 2.02a | 49.55 ± 2.86a | 49.35 ± 2.19a | 49.95 ± 3.05a | 49.70 ± 2.83a | 49.25 ± 3.14a | 49.00 ± 2.13a |
| MCV (fL) | 57.45 ± 1.91a | 57.40 ± 0.71a | 57.65 ± 2.19a | 57.65 ± 2.05a | 57.25 ± 2.32a | 57.39 ± 2.16a | 57.77 ± 1.09a | 57.23 ± 1.77a |
| MCH (pg) | 16.02 ± 0.84a | 16.15 ± 1.48a | 16.11 ± 0.18a | 16.14 ± 0.50a | 16.19 ± 0.74a | 16.09 ± 1.41a | 16.06 ± 0.81a | 15.90 ± 0.57a |
| PLT (109/L) | 556.56 ± 68.49a | 553.55 ± 64.35a | 554.59 ± 71.22a | 554.00 ± 65.46a | 555.54 ± 65.76a | 556.13 ± 69.60a | 557.02 ± 70.31a | 559.03 ± 74.95a |
| AKP (U/L) | 123.87 ± 3.80a | 121.95 ± 2.98a | 124.03 ± 2.76a | 121.89 ± 3.64a | 123.91 ± 2.85a | 121.80 ± 2.13a | 123.84 ± 3.79a | 121.88 ± 2.84a |
| AST (U/L) | 143.89 ± 4.09a | 145.72 ± 3.84a | 142.86 ± 3.61a | 144.77 ± 3.96a | 143.82 ± 3.41a | 145.18 ± 4.23a | 143.92 ± 3.06a | 145.66 ± 3.50a |
| ALT (U/L) | 18.38 ± 1.47a | 20.33 ± 2.39a | 18.42 ± 2.33a | 20.36 ± 2.43a | 18.39 ± 2.28a | 20.35 ± 1.37a | 18.37 ± 1.42a | 20.35 ± 2.32a |
| LDH (U/L) | 967.89 ± 20.74a | 972.72 ± 19.99a | 969.24 ± 21.43a | 965.96 ± 20.12a | 980.48 ± 25.79a | 968.65 ± 23.08a | 967.17 ± 21.37a | 976.52 ± 24.01a |
| GGT (U/L) | 4.28 ± 2.16a | 4.31 ± 3.09a | 4.10 ± 2.83a | 4.44 ± 2.85a | 4.51 ± 1.98a | 4.37 ± 2.38a | 4.42 ± 2.12a | 4.59 ± 2.77a |
| CRE (mg/dL) | 14.67 ± 1.23a | 15.03 ± 0.88a | 15.83 ± 1.09a | 15.72 ± 1.38a | 16.42 ± 1.41a | 15.62 ± 0.74a | 14.34 ± 1.17a | 16.10 ± 1.23a |
| Urea (mg/dL) | 11.58 ± 0.83a | 9.64 ± 1.23a | 11.03 ± 0.75a | 10.20 ± 1.04a | 11.77 ± 0.82a | 10.48 ± 0.31a | 12.23 ± 0.64a | 9.92 ± 0.81a |
| TC (mg/dL) | 2.88 ± 0.27a | 2.44 ± 0.48a | 2.66 ± 0.65a | 2.51 ± 1.09a | 2.74 ± 0.38a | 2.55 ± 0.09a | 2.72 ± 0.53a | 2.48 ± 0.73a |
n = 10 male rats per group. BP, blue pigment
Data are expressed as Means ± SD (n = 5). No significant difference was found between groups (one-way ANOVA,
Table 1.
Table 2.
TOP

