- About
- Browse Articles
-
Special Issues
- Pioneering strategies for overcoming bacterial drug resistance (2026)
- Advancing microbial engineering through synthetic biology (2025)
- Host-associated microbiome (2024)
- Bacterial regulatory mechanisms for the control of complex cellular mechanisms (2023)
- Two years into COVID-19 pandemic: Where are we? (2022)
- Collections
- For Contributors
- Policies
- E-Submission

- About
- Browse Articles
-
Special Issues
- Pioneering strategies for overcoming bacterial drug resistance (2026)
- Advancing microbial engineering through synthetic biology (2025)
- Host-associated microbiome (2024)
- Bacterial regulatory mechanisms for the control of complex cellular mechanisms (2023)
- Two years into COVID-19 pandemic: Where are we? (2022)
- Collections
- Policies
- For Contributors
Articles
- Page Path
- HOME > J. Microbiol > Volume 63(8); 2025 > Article
-
Full article
Crystal structures of the μ2 subunit of clathrin-adaptor protein 2 in complex with peptides derived from human papillomavirus 16 E7 - Sujin Jung1,2, Dahwan Lim1, Joon Sig Choi2, Ho-Chul Shin3, Seung Jun Kim1,3,*, Bonsu Ku1,*
-
Journal of Microbiology 2025;63(8):e2505003.
DOI: https://doi.org/10.71150/jm.2505003
Published online: August 31, 2025
1Orphan Disease Therapeutic Target Research Center, Korea Research Institute of Bioscience and Biotechnology, Daejeon 34141, Republic of Korea
2Department of Biochemistry, Chungnam National University, Daejeon 34134, Republic of Korea
3Critical Diseases Diagnostics Convergence Research Center, Korea Research Institute of Bioscience and Biotechnology, Daejeon 34141, Republic of Korea
- *Correspondence Seung Jun Kim ksj@kribb.re.kr Bonsu Ku bku@kribb.re.kr
© The Author(s), under exclusive licence to Microbiological Society of Korea 2026
This is an Open Access article distributed under the terms of the Creative Commons Attribution 4.0 International License (CC BY 4.0) (https://creativecommons.org/licenses/by/4.0/) which permits unrestricted use, distribution, and reproduction in any medium, provided the original work is properly cited.
ABSTRACT
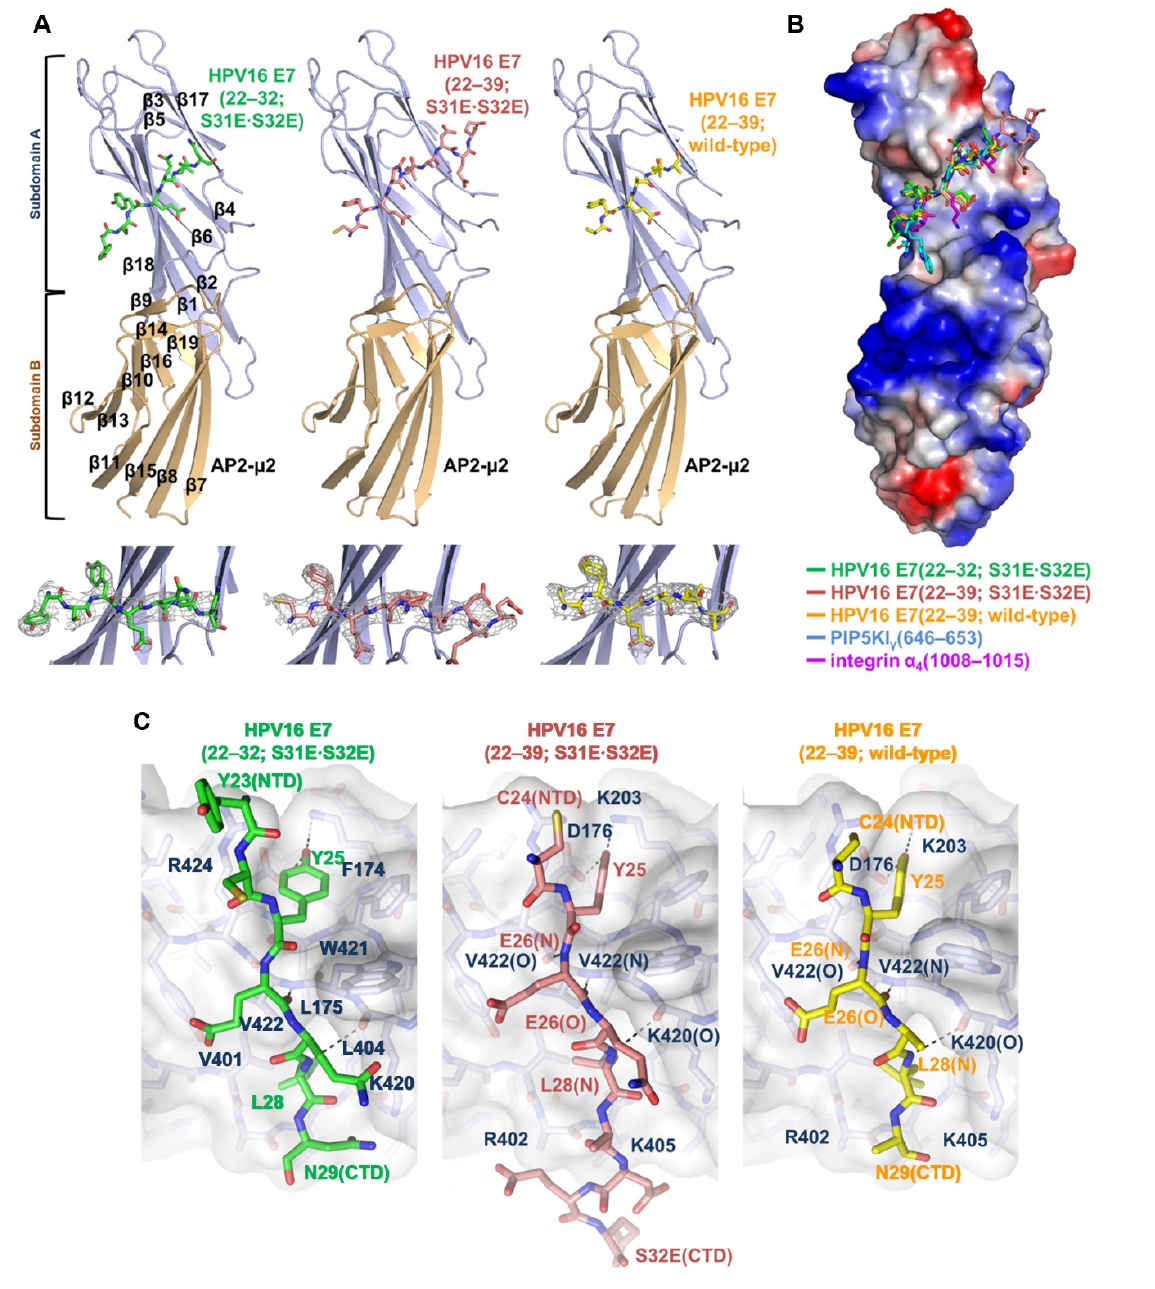
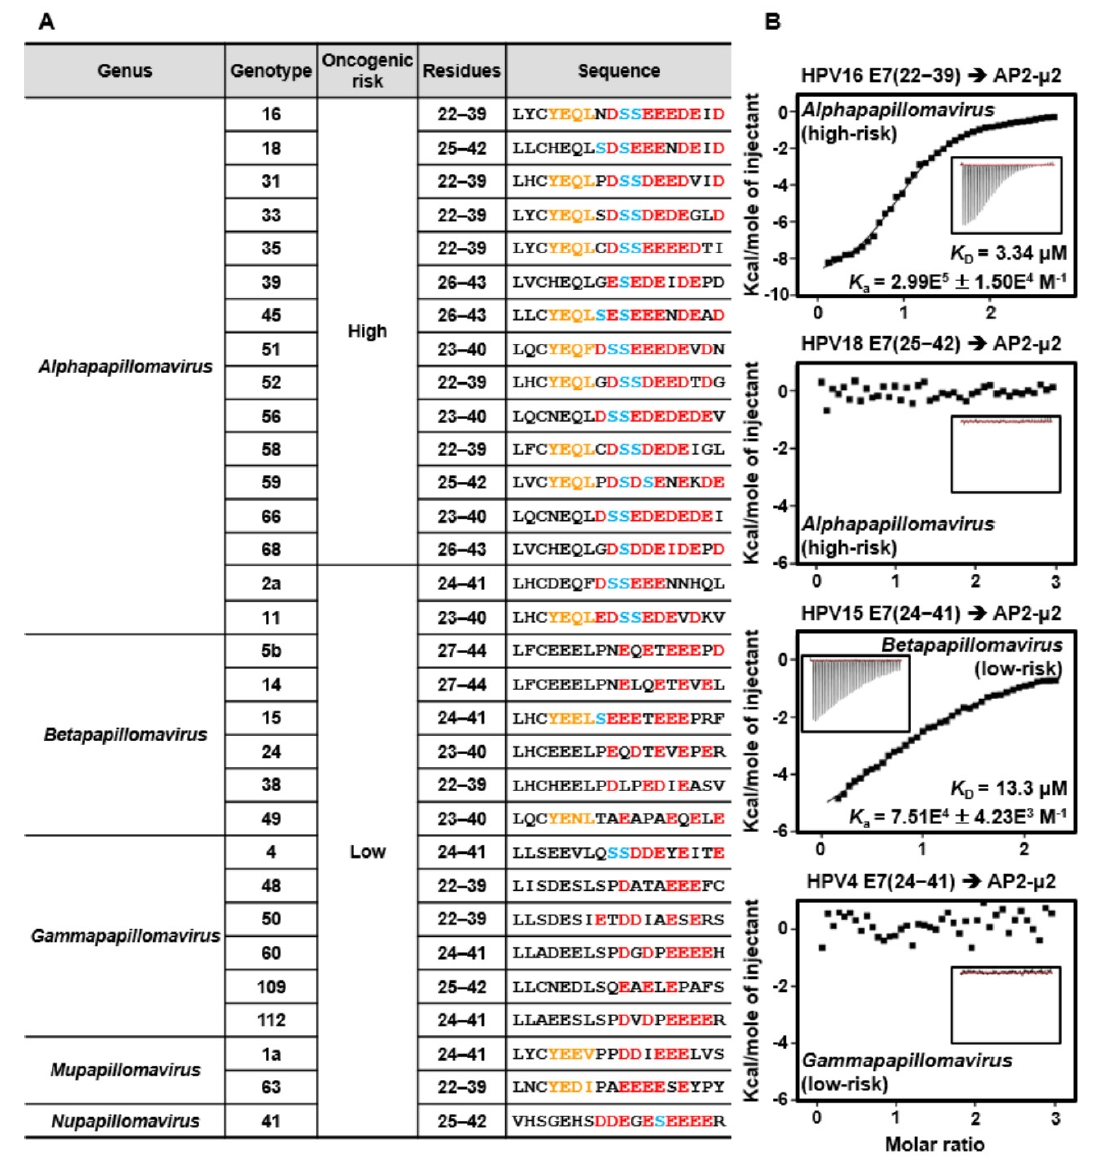
- Human papillomaviruses (HPVs) cause abnormal cellular proliferation, leading to malignant or benign lesions, such as cervical cancer and warts. The genome of HPV16, the most prevalent high-risk oncogenic genotype within the Alphapapillomavirus genus, encodes two oncoproteins. One of these proteins, E7, interacts with multiple host proteins and modulates their functions through distinct pathways. The CR2 domain of HPV16 E7 was recently reported to interact with the μ2 subunit of clathrin-adaptor protein 2 (AP2-μ2), an adaptor complex involved in cargo internalization during clathrin-mediated endocytosis. In this study, to provide molecular insights into their intermolecular interactions, we determined the crystal structures of AP2-μ2 in complex with the HPV16 E7-derived peptides. Subsequent biochemical analyses revealed that this interaction is primarily maintained by the Y-x-x-Φ motif and further supported by acidic cluster residues of HPV16 E7. Finally, sequence alignment of the E7 CR2 domains from various HPV genotypes showed that the AP2-μ2-binding motif is largely conserved in Alpha-, Beta-, and Mupapillomaviruses, but not in Nu- and Gammapapillomaviruses.
Introduction
Materials and Methods
Results
Discussion
Acknowledgments
We are grateful to Dr. Myung Hee Kim, Dr. Jungwon Hwang (Korea Research Institute of Bioscience and Biotechnology, Korea), and Dr. Eunha Hwang (Korea Basic Science Institute, Korea) for their assistance with ITC experiments. X-ray diffraction data were collected at beamlines 5C and 7A of the Pohang Accelerator Laboratory, Korea. This work was supported by grants from the National Research Foundation of Korea (RS-2023-00278696), National Research Council of Science and Technology (CRC22021-700), Korea Research Institute of Bioscience and Biotechnology Research Initiative Programs (KGM9952522 and KGM1322511), and Korea Basic Science Institute R&D program (C513550), supervised by the Ministry of Science and ICT, Korea.
Conflict of Interest
The authors declare that they have no competing interests.
Data Availability
The coordinates of the structures, together with the structure factors, were deposited in PDB under accession code 9UUK, 9UUL, and 9UUJ for AP2-μ2−HPV16 E7(22–32; S31E∙S32E), AP2-μ2−HPV16 E7(22–39; S31E∙S32E), and AP2-μ2−HPV16 E7(22–39), respectively.


| Protein | AP2-μ2−HPV16 E7 (22–32; S31E∙S32E) | AP2-μ2−HPV16 E7 (22–39; S31E∙S32E) | AP2-μ2−HPV16 E7 (22–39) |
|---|---|---|---|
| PDB code | 9UUK | 9UUL | 9UUJ |
| Data Collection | |||
| Space group | P64 | P64 | P64 |
| Unit cell dimensions | |||
| a, b, c (Å) | 125.2, 125.2, 73.5 | 125.6, 125.6, 74.3 | 125.1, 125.1, 73.6 |
| α, β, γ (o) | 90, 90, 120 | 90, 90, 120 | 90, 90, 120 |
| Resolution (Å) | 50.0−3.2 (3.26−3.20)a | 50.0−3.3 (3.36−3.30) | 50.0−3.3 (3.76−3.70) |
| Rsymb (%) | 6.3 (36.7) | 4.3 (38.8) | 7.4 (48.2) |
| I/σ (I) | 17.5 (1.6) | 15.7 (1.6) | 21.0 (3.2) |
| Completeness (%) | 97.4 (97.0) | 97.8 (90.7) | 94.7 (96.9) |
| Redundancy | 5.1 | 5.1 | 7.3 |
| Refinement | |||
| Resolution (Å) | 50.0−3.2 | 50.0−3.3 | 50.0−3.7 |
| Number of reflections | 10714 | 9960 | 6751 |
| Rworkc/Rfree (%) | 20.5/24.4 | 19.4/22.5 | 20.7/23.4 |
| Number of atoms | |||
| Protein | 1876 | 1933 | 1944 |
| Peptide | 64 | 75 | 45 |
| RMSD | |||
| Bond lengths (Å) | 0.011 | 0.011 | 0.003 |
| Bond angles (o) | 1.213 | 1.131 | 0.618 |
| Ramachandran plot (%) | |||
| Most favored region | 92.3 | 92.8 | 93.5 |
| Additionally allowed region | 7.7 | 7.2 | 6.5 |
| Average B-values (Å2) | |||
| Protein | 87.8 | 96.0 | 112.6 |
| Peptide | 104.2 | 120.2 | 123.8 |
aThe numbers in parentheses are statistics from the shell with the highest resolution.
bRsym = Σ |Iobs - Iavg| / Iobs, where Iobs is the observed intensity of individual reflection and Iavg is the average across symmetry equivalents.
cRwork = Σ ||Fo| - |Fc|| / Σ |Fo|, where |Fo| and |Fc| are the observed and calculated structure factor amplitudes, respectively. Rfree was calculated with 9.9–10.1% of the data.
- Adams PD, Afonine PV, Bunkóczi G, Chen VB, Davis IW, et al. 2010. PHENIX: a comprehensive Python-based system for macromolecular structure solution. Acta Crystallogr D Biol Crystallogr. 66: 213–221. ArticlePubMedPMC
- Bandolin L, Borsetto D, Fussey J, Da Mosto MC, Nicolai P, et al. 2020. Beta human papillomaviruses infection and skin carcinogenesis. Rev Med Virol. 30: e2104. ArticlePubMedLink
- Basukala O, Trejo-Cerro O, Myers MP, Pim D, Massimi P, et al. 2022. HPV-16 E7 interacts with the endocytic machinery via the AP2 adaptor μ2 subunit. mBio. 13: e0230222. ArticlePubMedLink
- Batonick M, Favre M, Boge M, Spearman P, Höning S, et al. 2005. Interaction of HIV-1 Gag with the clathrin-associated adaptor AP-2. Virology. 342: 190–200. ArticlePubMed
- Beacham GM, Partlow EA, Hollopeter G. 2019. Conformational regulation of AP1 and AP2 clathrin adaptor complexes. Traffic. 20: 741–751. ArticlePubMedPMCLink
- De Franceschi N, Arjonen A, Elkhatib N, Denessiouk K, Wrobel AG, et al. 2016. Selective integrin endocytosis is driven by interactions between the integrin α-chain and AP2. Nat Struct Mol Biol. 23: 172–179. ArticlePubMedPMCPDF
- Egawa N, Egawa K, Griffin H, Doorbar J. 2015. Human papillomaviruses; epithelial tropisms, and the development of neoplasia. Viruses. 7: 3863–3890. ArticlePubMedPMC
- Emsley P, Cowtan K. 2004. Coot: model-building tools for molecular graphics. Acta Crystallogr D Biol Crystallogr. 60: 2126–2132. ArticlePubMed
- Firzlaff JM, Luscher B, Eisenman RN. 1991. Negative charge at the casein kinase II phosphorylation site is important for transformation but not for Rb protein binding by the E7 protein of human papillomavirus type 16. Proc Natl Acad Sci USA. 88: 5187–5191. ArticlePubMedPMC
- Genovese NJ, Banerjee NS, Broker TR, Chow LT. 2008. Casein kinase II motif-dependent phosphorylation of human papillomavirus E7 protein promotes p130 degradation and S-phase induction in differentiated human keratinocytes. J Virol. 82: 4862–4873. ArticlePubMedPMCLink
- Ha NC, Tonozuka T, Stamos JL, Choi HJ, Weis WI. 2004. Mechanism of phosphorylation-dependent binding of APC to β-catenin and its role in β-catenin degradation. Mol Cell. 15: 511–521. ArticlePubMed
- Han F, Guo XY, Jiang MX, Xia NS, Gu Y, et al. 2024. Structural biology of the human papillomavirus. Structure. 32: 1877–1892. ArticlePubMed
- Harden ME, Munger K. 2017. Human papillomavirus molecular biology. Mutat Res Rev Mutat Res. 772: 3–12. ArticlePubMed
- Jung S, Lee HS, Shin HC, Choi JS, Kim SJ, et al. 2023. Crystal structures of Plk1 polo-box domain bound to the human papillomavirus minor capsid protein L2-derived peptide. J Microbiol. 61: 755–764. ArticlePubMedPDF
- Kahlfeldt N, Vahedi-Faridi A, Koo SJ, Schäfer JG, Krainer G, et al. 2010. Molecular basis for association of PIPKIγ-p90 with clathrin adaptor AP-2. J Biol Chem. 285: 2734–2749. ArticlePubMed
- Kukic P, Lo Piccolo GM, Nogueira MO, Svergun DI, Vendruscolo M, et al. 2019. The free energy landscape of the oncogene protein E7 of human papillomavirus type 16 reveals a complex interplay between ordered and disordered regions. Sci Rep. 9: 5822.ArticlePubMedPMCPDF
- LeConte BA, Szaniszlo P, Fennewald SM, Lou DI, Qiu S, et al. 2018. Differences in the viral genome between HPV-positive cervical and oropharyngeal cancer. PLoS One. 13: e0203403. ArticlePubMedPMC
- Lee HS, Kim MW, Jin KS, Shin HC, Kim WK, et al. 2021. Molecular analysis of the interaction between human PTPN21 and the oncoprotein E7 from human papillomavirus genotype 18. Mol Cells. 44: 26–37. ArticlePubMedPMC
- Lee JO, Russo AA, Pavletich NP. 1998. Structure of the retinoblastoma tumour-suppressor pocket domain bound to a peptide from HPV E7. Nature. 391: 859–865. ArticlePubMedPDF
- Lee HS, Yun HY, Lee EW, Shin HC, Kim SJ, et al. 2022. Structural and biochemical analysis of the PTPN4 PDZ domain bound to the C-terminal tail of the human papillomavirus E6 oncoprotein. J Microbiol. 60: 395–401. ArticlePubMedPDF
- Lim D, Shin HC, Choi JS, Kim SJ, Ku B. 2021. Crystal structure of human LC8 bound to a peptide from Ebola virus VP35. J Microbiol. 59: 410–416. ArticlePubMedPDF
- Martinez-Zapien D, Ruiz FX, Poirson J, Mitschler A, Ramirez J, et al. 2016. Structure of the E6/E6AP/p53 complex required for HPV-mediated degradation of p53. Nature. 529: 541–545. ArticlePubMedPMCPDF
- McCoy AJ, Grosse-Kunstleve RW, Adams PD, Winn MD, Storoni LC, et al. 2007. Phaser crystallographic software. J Appl Crystallogr. 40: 658–674. ArticlePubMedPMC
- Mettlen M, Chen PH, Srinivasan S, Danuser G, Schmid SL. 2018. Regulation of clathrin-mediated endocytosis. Annu Rev Biochem. 87: 871–896. ArticlePubMedPMC
- Mittal S, Banks L. 2017. Molecular mechanisms underlying human papillomavirus E6 and E7 oncoprotein-induced cell transformation. Mutat Res Rev Mutat Res. 772: 23–35. ArticlePubMed
- Neveu G, Barouch-Bentov R, Ziv-Av A, Gerber D, Jacob Y, et al. 2012. Identification and targeting of an interaction between a tyrosine motif within hepatitis C virus core protein and AP2M1 essential for viral assembly. PLoS Pathog. 8: e1002845. ArticlePubMedPMC
- Otwinowski Z, Minor W. 1997. Processing of X-ray diffraction data collected in oscillation mode. Methods Enzymol. 276: 307–326. ArticlePubMed
- Owen DJ, Evans PR. 1998. A structural explanation for the recognition of tyrosine-based endocytotic signals. Science. 282: 1327–1332. ArticlePubMedPMC
- Rohde G, Wenzel D, Haucke V. 2002. A phosphatidylinositol (4,5)-bisphosphate binding site within μ2-adaptin regulates clathrin-mediated endocytosis. J Cell Biol. 158: 209–214. ArticlePubMedPMCPDF
- Serrano B, Brotons M, Bosch FX, Bruni L. 2018. Epidemiology and burden of HPV-related disease. Best Pract Res Clin Obstet Gynaecol. 47: 14–26. ArticlePubMed
- Sorkin A, Goh LK. 2009. Endocytosis and intracellular trafficking of ErbBs. Exp Cell Res. 315: 683–696. ArticlePubMed
- Stoneham CA, Singh R, Jia X, Xiong Y, Guatelli J. 2017. Endocytic activity of HIV-1 Vpu: Phosphoserine-dependent interactions with clathrin adaptors. Traffic. 18: 545–561. ArticlePubMedPMCLink
- Tahseen D, Rady PL, Tyring SK. 2021. Effects of β-HPV on DNA damage response pathways to drive carcinogenesis: a review. Virus Genes. 57: 23–30. ArticlePubMedPDF
- Todorovic B, Hung K, Massimi P, Avvakumov N, Dick FA, et al. 2012. Conserved region 3 of human papillomavirus 16 E7 contributes to deregulation of the retinoblastoma tumor suppressor. J Virol. 86: 13313–13323. ArticlePubMedPMCLink
- Tommasino M. 2014. The human papillomavirus family and its role in carcinogenesis. Semin Cancer Biol. 26: 13–21. ArticlePubMed
- Van Minnebruggen G, Favoreel HW, Nauwynck HJ. 2004. Internalization of pseudorabies virus glycoprotein B is mediated by an interaction between the YQRL motif in its cytoplasmic domain and the clathrin-associated AP-2 adaptor complex. J Virol. 78: 8852–8859. ArticlePubMedPMCLink
- Wang J, Zhou D, Prabhu A, Schlegel R, Yuan H. 2010. The canine papillomavirus and gamma HPV E7 proteins use an alternative domain to bind and destabilize the retinoblastoma protein. PLoS Pathog. 6: e1001089. ArticlePubMedPMC
- Yuan S, Chu H, Huang J, Zhao X, Ye ZW, et al. 2020. Viruses harness YxxØ motif to interact with host AP2M1 for replication: a vulnerable broad-spectrum antiviral target. Sci Adv. 6: eaba7910. ArticlePubMedPMC
- Yun HY, Kim MW, Lee HS, Kim W, Shin JH, et al. 2019. Structural basis for recognition of the tumor suppressor protein PTPN14 by the oncoprotein E7 of human papillomavirus. PLoS Biol. 17: e3000367. ArticlePubMedPMC
- Zhu L. 2005. Tumour suppressor retinoblastoma protein Rb: a transcriptional regulator. Eur J Cancer. 41: 2415–2427. ArticlePubMed
References
Supplementary Information
References
Citations
- Molecular analysis of the interaction between ubiquitin-specific protease 7 and large T antigen of Merkel cell polyomavirus
Dahwan Lim, Jung-Hwan Park, Ho-Chul Shin, Seung Jun Kim, Bonsu Ku
Journal of Microbiology.2026; 64(2): e2511009. CrossRef - Crystal structure of Bcl-2 from lymphocystis disease virus 2 in complex with the BH3 domain of zebrafish BaxA
Dahwan Lim, So Hyeon Park, Joon Sig Choi, Ho-Chul Shin, Seung Jun Kim, Bonsu Ku
Journal of Microbiology.2026; 64(5): e2512006. CrossRef - The absorption and endocytosis mechanism of flaxseed cyclic peptide CLQ is mediated by its binding to clathrin
Yuwan Nie, Miao Zheng, Peilong Sun, Zeyuan Deng, Kai Yang, Xianguo Zou
Food Research International.2026; 242: 119967. CrossRef
 ePub Link
 Cite this Article
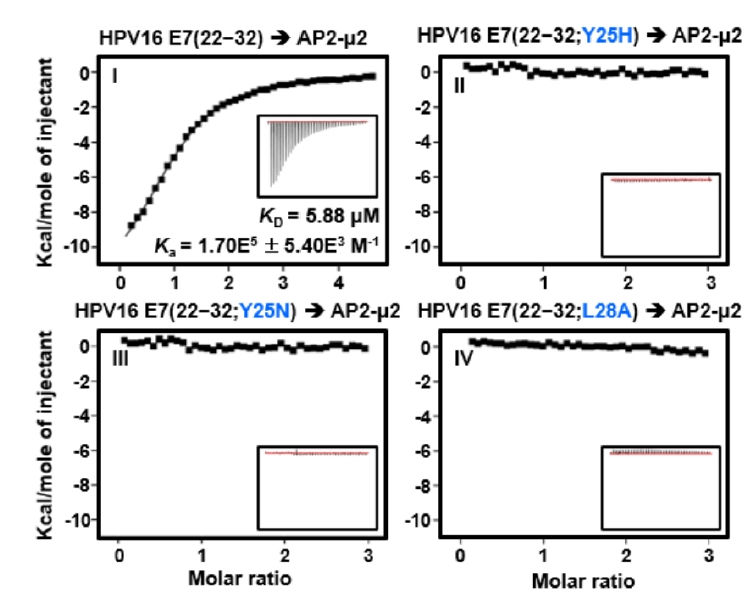


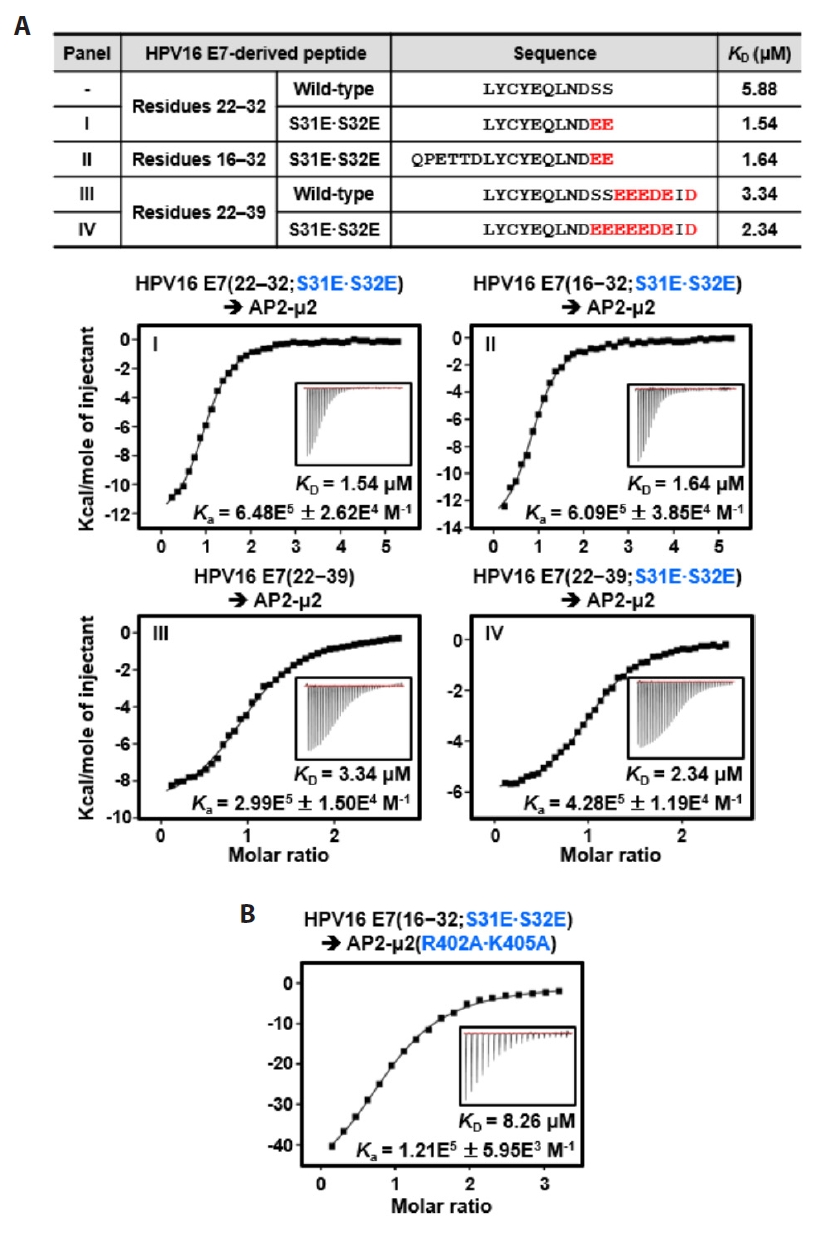

Fig. 1.
Fig. 2.
Fig. 3.
Fig. 4.
| Protein | AP2-μ2−HPV16 E7 (22–32; S31E∙S32E) | AP2-μ2−HPV16 E7 (22–39; S31E∙S32E) | AP2-μ2−HPV16 E7 (22–39) |
|---|---|---|---|
| PDB code | 9UUK | 9UUL | 9UUJ |
| Data Collection | |||
| Space group | P64 | P64 | P64 |
| Unit cell dimensions | |||
| a, b, c (Å) | 125.2, 125.2, 73.5 | 125.6, 125.6, 74.3 | 125.1, 125.1, 73.6 |
| α, β, γ (o) | 90, 90, 120 | 90, 90, 120 | 90, 90, 120 |
| Resolution (Å) | 50.0−3.2 (3.26−3.20) |
50.0−3.3 (3.36−3.30) | 50.0−3.3 (3.76−3.70) |
| Rsym |
6.3 (36.7) | 4.3 (38.8) | 7.4 (48.2) |
| I/σ (I) | 17.5 (1.6) | 15.7 (1.6) | 21.0 (3.2) |
| Completeness (%) | 97.4 (97.0) | 97.8 (90.7) | 94.7 (96.9) |
| Redundancy | 5.1 | 5.1 | 7.3 |
| Refinement | |||
| Resolution (Å) | 50.0−3.2 | 50.0−3.3 | 50.0−3.7 |
| Number of reflections | 10714 | 9960 | 6751 |
| Rwork |
20.5/24.4 | 19.4/22.5 | 20.7/23.4 |
| Number of atoms | |||
| Protein | 1876 | 1933 | 1944 |
| Peptide | 64 | 75 | 45 |
| RMSD | |||
| Bond lengths (Å) | 0.011 | 0.011 | 0.003 |
| Bond angles (o) | 1.213 | 1.131 | 0.618 |
| Ramachandran plot (%) | |||
| Most favored region | 92.3 | 92.8 | 93.5 |
| Additionally allowed region | 7.7 | 7.2 | 6.5 |
| Average B-values (Å2) | |||
| Protein | 87.8 | 96.0 | 112.6 |
| Peptide | 104.2 | 120.2 | 123.8 |
The numbers in parentheses are statistics from the shell with the highest resolution.
Table 1.
TOP

